

TL;DR
- 5.5%: Virginia commercial electricity sales growth over the 12 months through March 2026, measured against the prior 12 months.
- 5.8%: Texas commercial electricity sales growth over that same trailing-annual window.
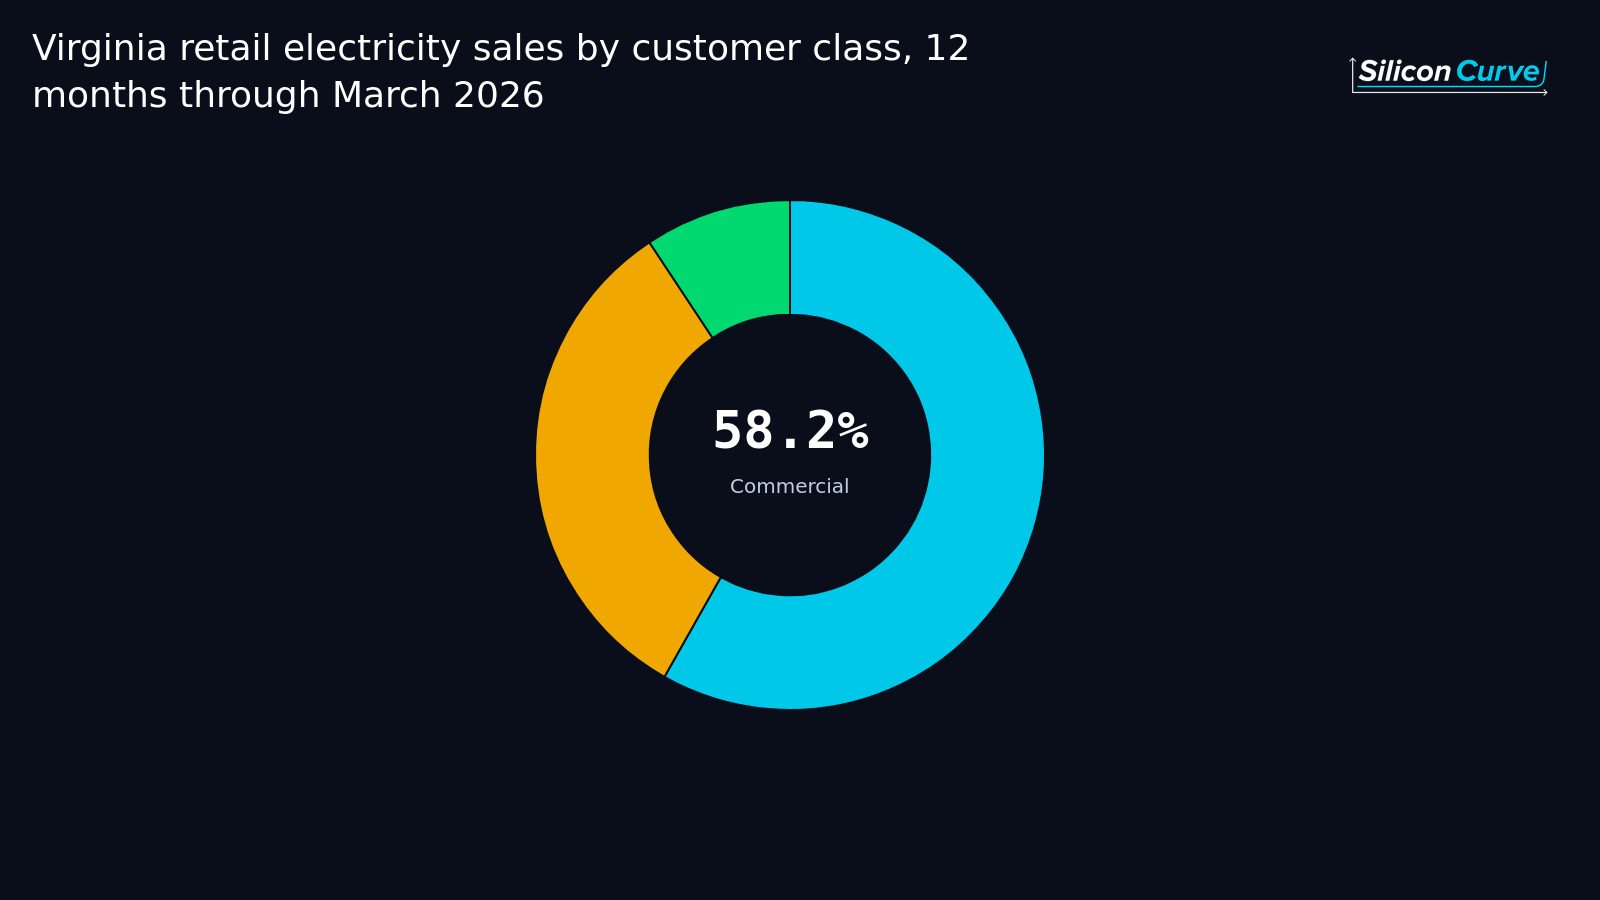
- 58.2%: commercial’s share of Virginia retail electricity sales for the 12 months through March 2026, up from a year earlier.
- -3.2%: the change in Texas industrial electricity sales over the same 12 months, pointing the other way.
EIA data through March 2026.
So which customer class is actually growing?
Exactly one of the three, and it’s the same one in both states. Virginia commercial electricity sales rose 5.5% across the twelve months through March 2026 against the twelve months before that, and Texas commercial electricity sales rose 5.8% on the same trailing-annual basis. Residential and industrial were flat or shrinking in both places.
We went into this expecting the growth to be spread around. It isn’t. When we pulled the three EIA retail customer classes for Virginia and Texas, we assumed we’d find commercial out front and the other two trailing behind it by a point or so, because that’s the shape most load stories take when you look at them from far enough away. Instead the picture is closer to binary. One class is adding volume. The others are not participating.
That’s a strange thing to find in two states that share almost nothing structurally. Virginia and Texas have different generation mixes, different market designs, different regulatory postures, and different industrial histories. They are not two versions of the same system. And yet the growth in retail electricity sales in both is concentrated in commercial electricity sales, at almost exactly the same rate, over exactly the same window. Two independent systems arriving at the same answer is the kind of coincidence that makes us go back and check the pull twice.
When two grids that share nothing structurally produce the same growth signature in the same customer class, the interesting question stops being “how fast” and becomes “what is this class made of now.”
You can pull the underlying series yourself from the EIA Electricity Data Browser, which publishes monthly retail sales by state and by customer class. The classes are the standard three. Nothing exotic is happening in the data collection. What’s happening is in the composition.
What does it mean when commercial electricity sales are 58.2% of a state?
It means the class has stopped being one slice of the pie and started being the pie. Commercial electricity sales accounted for 58.2% of Virginia retail electricity sales over the 12 months through March 2026, and that share was higher than it was a year earlier. Residential and industrial split what’s left.
A majority share changes the character of a system. When no class holds more than about a third of volume, a forecast that gets one class badly wrong is survivable, because the other two absorb the error. When one class is nearly six tenths of the load and it’s also the only class growing, the state forecast and the commercial forecast are effectively the same document with different letterheads. Getting commercial electricity sales wrong is getting everything wrong.
This is where our read starts to diverge from the usual framing. Most of the coverage we see treats concentrated load growth as a capacity question: can the system serve it, and when. That’s a real question, but it’s the second one. The first is a portfolio question. A utility whose volume is spread across three classes with different weather sensitivities, different price elasticities and different business cycles has natural diversification built into its revenue. A utility where one class is the majority and the growth doesn’t. Concentration cuts both ways, and it cuts in whichever direction that one class moves.
We’d also flag that a share is not a level and a level is not a trajectory. 58.2% is a snapshot of a mix in motion, and the direction of that motion, not the number itself, is the thing worth arguing about. The number just tells you the argument is no longer theoretical.
Is the commercial electricity sales story the same in both states?
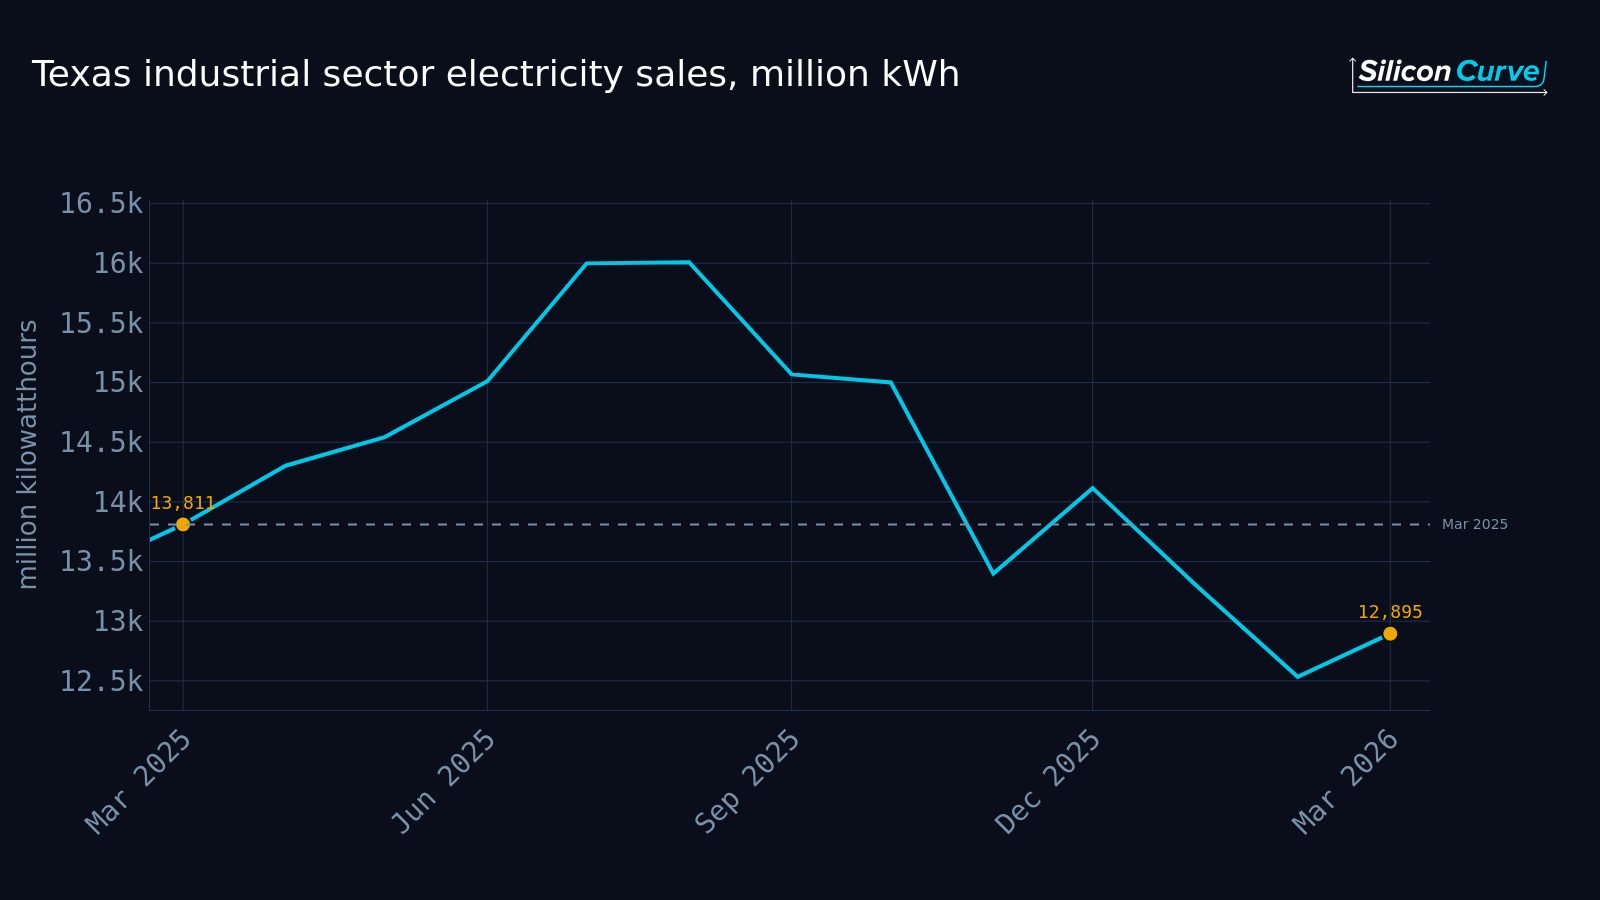
No, and this is the part we found genuinely surprising. The growth rates in commercial electricity sales are nearly identical, but they are landing on top of completely different bases and doing completely different work. Texas industrial electricity sales fell 3.2% across the same 12 months through March 2026. Virginia’s other classes were not falling like that.
So you have two states with matching commercial growth rates where that growth means two different things. In one, it’s addition. In the other, at least some of it is replacement. A grid where one class is growing while another is contracting has a very different net load path, a very different revenue path, and a very different set of stranded-asset conversations than a grid where one class is growing and the rest are simply holding station.
We think this is the single most under-appreciated thing in the retail data right now. Headlines about commercial electricity sales growth get written as if a percentage is a percentage. It isn’t. The same growth rate on a system that’s losing volume elsewhere and on a system that isn’t are two different facts wearing the same clothes, and the summary statistic hides the difference completely.
The composition question underneath this is not trivial to answer, and we don’t think anyone should be answering it from a single growth rate. But we’ll say this much: if your mental model is that commercial electricity sales growth means one thing everywhere, the Texas and Virginia numbers sitting side by side should make you uncomfortable in a productive way.
Who does this actually land on?
First on the people who write load forecasts for a living, and they already know. Everyone downstream of them finds out later.
Start with resource planners. A planning process that allocates future capacity by extrapolating historical class shares is, right now, extrapolating a mix that is visibly changing underneath it. That doesn’t make the process wrong, but it does mean the assumptions page is doing more work than usual and deserves more scrutiny than it usually gets.
Then state regulators and the parties who show up in rate cases. Class shares are inputs to a lot of proceedings, and when one class becomes the majority of volume in a state, the arithmetic behind those proceedings shifts whether or not anyone has filed anything about it. We’re not going to pretend to know how any given commission handles that. We’d only note that the question of who carries the fixed cost base of a system looks different when the volume is concentrated than when it’s spread, and the concentration is measurable now rather than projected.
Then economic development offices, which spend real money attracting load and now have data suggesting the classes they’ve historically courted are not the ones adding volume. Then transmission planners, whose siting horizon is long enough that a mix shift observed over twelve months is a leading indicator rather than a report card. Then industrial customers themselves, who are on a system whose center of gravity is moving away from them and who might reasonably want to know what that means for their position in the queue and their position in the rate structure.
And finally, the generation developers and the people financing them, who are underwriting assets against a demand curve. A demand curve where growth is broad is a different credit than one where growth is a single class in a single direction. Same megawatt-hours, different risk.
Why the obvious read here might be wrong
Because the obvious read is that a volume number is a volume number, and there’s a second series in this data that complicates it.
The reflexive objection to any sales growth figure is that it might be an artifact of something other than demand. That’s a fair objection and it deserves a real test rather than a hand-wave, which is exactly what we ran. We’ll say only that the test has an answer, that the answer is in the price data, and that it does not point where the objection assumes it points.
The second reflexive read is that this is a story about one state. It isn’t. Virginia is the one everybody looks at, and Virginia is where the share number is dramatic, but the growth rate in Texas commercial electricity sales is the higher of the two and the surrounding conditions are entirely different. Any explanation that only works in one state doesn’t survive contact with the other, and that constraint is more useful for thinking clearly than another decimal place would be.
Two states, one growing class, and two completely different things that growth is doing to the system underneath it.
The honest summary is that commercial electricity sales are the only retail class adding volume in either state, that the mix is shifting fast enough to see in a twelve-month window, and that the meaning of the shift depends on what else is happening in each system. Anyone selling you a one-line explanation for both states at once is selling you something.
Get the full breakdown
The brief above gives you the headline. The report gives you the machinery: the full class-by-class comparison for both states, the share shifts on both sides of the ledger and how far each class moved, the price test on whether Virginia’s commercial electricity sales growth reflects demand or something else, the measurement choices behind every figure and where they matter, the caveats attached to the series that carry them, and what we’re watching next as the mix keeps moving.
If you plan, finance, regulate or buy on either of these grids, the composition is the part you’ll actually use.
Read the full report on commercial electricity load growth in Virginia and Texas