

TL;DR
- 184.5%: New York‘s residential rate ran that far above the state’s own industrial rate on trailing 12-month average prices through June 2026, the widest electricity rate spread in the ranked field.
- 102.7%: the U.S. residential-to-industrial figure over the same trailing twelve months, the benchmark every jurisdiction gets measured against.
- 84.7%: the median electricity rate spread across the ranked field, on trailing 12-month prices through June 2026.
- 51 jurisdictions: 50 states plus the District of Columbia, each with its own answer to the question of what power costs there.
What is the electricity rate spread, and why does it matter?
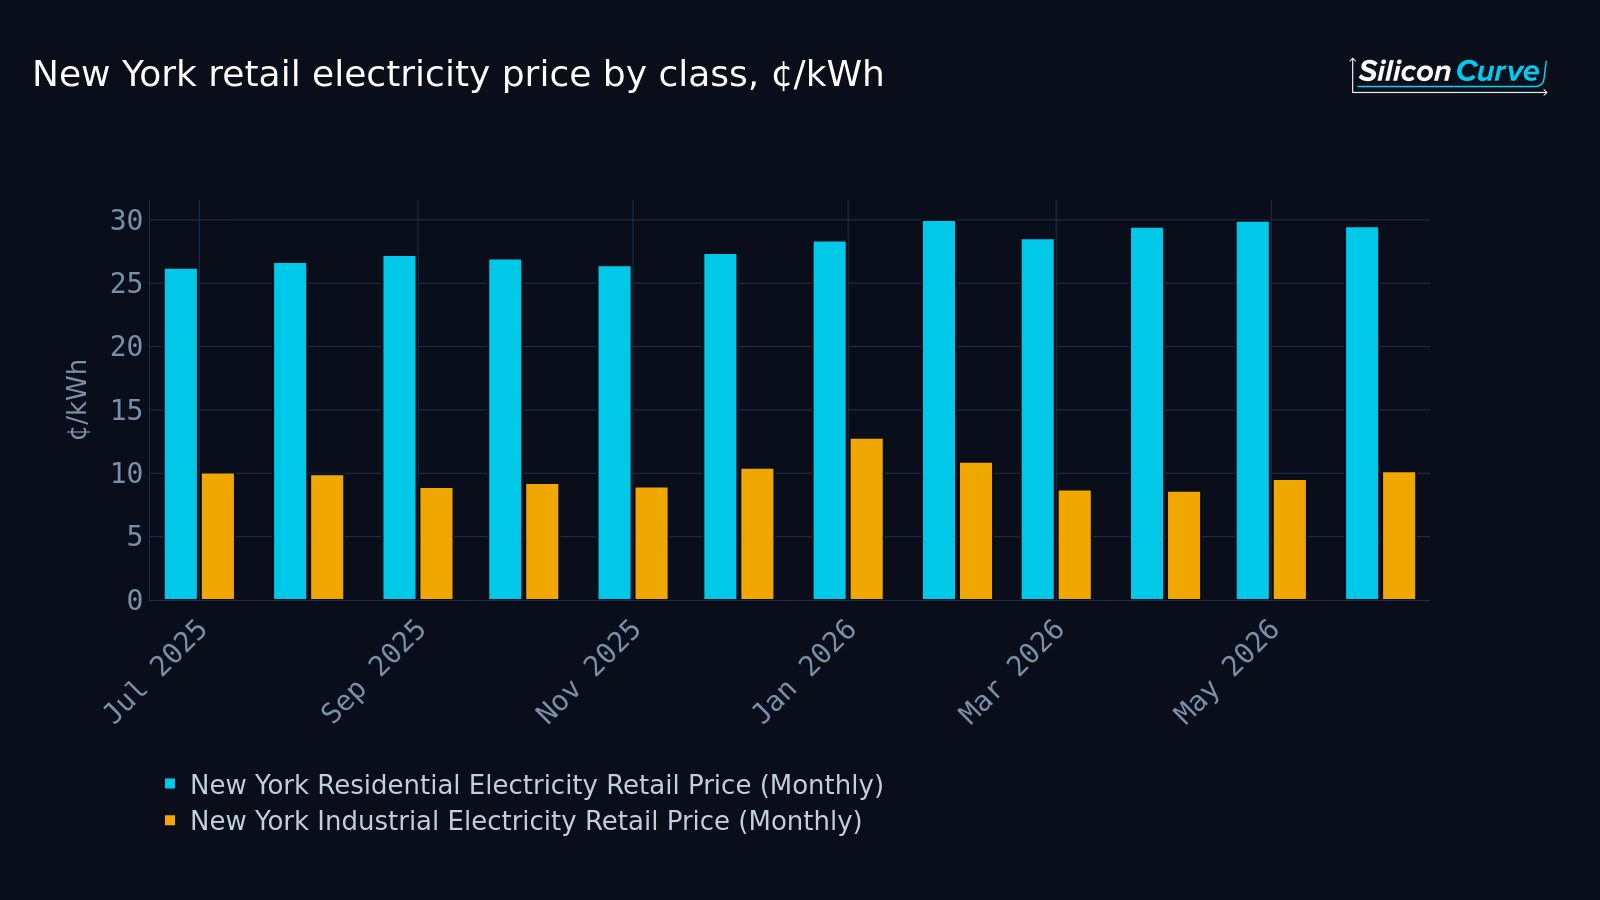
The electricity rate spread is the gap between what one class of customer is billed per kilowatt-hour and what another class is billed in the same state, and the reason it matters is that it is enormous in some places and modest in others. In New York, on trailing 12-month average retail prices through June 2026, the residential rate stood 184.5% above the industrial rate. That is the widest reading in a field of 51 jurisdictions, and it is not a rounding difference from the pack. It is a different regime.
We’ve spent enough time in retail price data to know the instinct it produces. You see a national number, you anchor on it, you move on. The trouble is that the national number is an average of jurisdictions that do not resemble each other, and the electricity rate spread is where that dissimilarity is most visible. Two customers in the same state, on the same grid, in the same month, can be sitting on rates that are nowhere near each other. Cross a state line and the relationship between them can invert in character entirely.
This is one of those findings that is boring right up until you try to use a single price in a model, and then it is the whole problem.
Who does the electricity rate spread actually land on?
It lands hardest on anyone who has to write a sentence beginning “electricity in the United States costs.” That is a much larger group than it sounds like: procurement teams building a cost case for a new site, analysts modeling operating expense across a multi-state footprint, journalists reaching for a national figure to characterize a state-level bill, and households comparing what they pay against a number they read somewhere that was never about them.
Every one of those people is implicitly assuming that a national average is a reasonable stand-in for the place they actually care about. The distribution of the electricity rate spread says that assumption has a wide error bar attached. The U.S. residential rate ran 102.7% above the U.S. industrial rate on the trailing twelve months, and that figure is genuinely useful as a benchmark. It is much less useful as a prediction of any single jurisdiction, because the field around it is spread out in a way an average cannot convey.
A national benchmark tells you where the middle of the country sits. It does not tell you where you sit.
Our read is that the electricity rate spread is the most under-used framing in retail power data, precisely because it is a within-state measure. It doesn’t require you to believe anything about fuel mix, weather, or policy. It just asks: in this state, how far apart are these two customer classes? And it turns out the answer varies by a factor you would not guess from looking at headline prices alone.
Does the national benchmark tell you anything at all?
Yes, but only about the benchmark. The median jurisdiction posted an electricity rate spread of 84.7% on trailing 12-month prices through June 2026, which sits below the national figure. That alone should reset how you read any comparison that pits one state’s residential price against another state’s industrial price and calls the difference meaningful. Those are different measures of different things, and the gap between them is doing work you haven’t accounted for.
The practical consequence is that the ranking order matters more than the average. If you know a state’s residential price, you do not thereby know its industrial price, and you certainly do not know how the two relate. The electricity rate spread is the missing link between those two facts, and it is not constant across the map. A state that looks expensive on one class can look unremarkable on the other. A state that looks cheap on one can be carrying a very wide internal gap.
That’s the part that changes decisions. Site selection, cost modeling, regional comparison work: all of it runs on the assumption that a state has a price. It has several, and the distance between them is a property of the state.
What does a wide electricity rate spread change for the people using this data?
It changes which number you should be quoting. If you are making an argument about industrial competitiveness, the residential series is not a proxy for it, and the size of the electricity rate spread is exactly how wrong that proxy would be. If you are making an argument about household costs, the industrial series is not a proxy either, and the same gap measures the error in the other direction.
There’s a second, subtler shift. Once you start reading states by their spread rather than their level, the map reorganizes. States you’d have grouped together on headline price separate. States you’d have treated as opposites land near each other. We find this genuinely disorienting the first time through, and useful every time after, because it forces the question of which class you actually mean whenever you say “the price of power here.”
For anyone tracking the buildout of large electricity consumers, the electricity rate spread is a cleaner comparison tool than a raw price, because it holds the state fixed. You are no longer comparing two grids. You are comparing two rate classes on the same grid, and then comparing that relationship across grids. It is a second-order measure and it behaves like one: noisier at the level of any single month, far more informative across a full field.
What questions does the ranking raise?
The first one is mechanical and unavoidable: when a jurisdiction posts a very wide electricity rate spread, is that because the residential side is unusually high, the industrial side is unusually low, or both at once? Those are three different stories with the same headline number, and you cannot tell them apart from the spread alone. You need the underlying levels, ranked, side by side.
The second is about the middle of the field. The distance between the median and the national benchmark implies the distribution is not symmetric around its center, which raises the question of how many jurisdictions actually clear the benchmark at all and how quickly the field falls away below it. A handful of very wide readings can pull an average a long way from where most of the field lives.
The third is about the commercial class, which we’ve deliberately left alone here. Commercial customers sit somewhere between residential and industrial in most people’s mental model, but “somewhere between” covers a lot of ground, and whether a given state’s commercial rate tracks its residential class or its industrial class is a real question with a real answer in the data. In at least one jurisdiction the ordering you’d expect does not hold.
The interesting states are not the ones at the top of the list. They are the ones where the internal ordering breaks.
Why the obvious read might be wrong
The obvious read of a wide electricity rate spread is that it says something about how expensive a state is. It doesn’t, not directly. A spread is a relationship between two prices, not a price. A jurisdiction can carry high absolute rates for everyone and still show a narrow gap, and a jurisdiction can carry moderate rates and show a wide one. Treating the spread as a proxy for expense is the single easiest way to misuse this data, and it’s the mistake we’d expect most readers to make on a first pass.
The second obvious read is that the extremes are the story. They’re the headline, but they aren’t the story. The story is the shape of the field between them: where the mass sits, how far the middle is from the benchmark, and which jurisdictions sit in positions their headline prices would never have predicted. That is a ranking problem, not a highlights problem, and it takes the full field to see.
EIA data through June 2026.
Get the full ranking
The brief above gives you three numbers and a way of thinking about them. It does not give you the field.
The full report ranks all 50 states, the District of Columbia, and the U.S. total on two rate-class spreads: residential versus industrial and commercial versus industrial. It profiles the two extremes of the electricity rate spread in detail, breaks out the distribution across the field including where the quartiles fall, identifies which jurisdictions clear the national benchmark and which sit well below it, flags the one place where the expected class ordering does not hold, and includes the per-state ranking tables and the underlying monthly price series behind every figure.
If you have ever needed to defend a single electricity price in a model, that ranking is the document that tells you which one to use.
Read the full report on the electricity rate gap by state
Primary source: U.S. Energy Information Administration, Electricity Data Browser.