Skip to content
Silicon Curve
Silicon Curve
  • Home
  • Briefs
  • Research Reports
  • Prices by State
  • Subscribe
  • Login

Silicon Curve Research

Commercial Electricity Sales Rose 5.5% in Virginia

October 16, 2026September 16, 2026 by Silicon Curve Research
Silicon Curve data report: Commercial Electricity Load Growth: Virginia and Texas Customer Classes Compared

Commercial electricity sales rose 5.5% in Virginia and 5.8% in Texas over the 12 months through March 2026, while every other customer class stalled.

Categories Energy Markets

The Electricity Rate Spread: New York Tops it at 184.5%

October 16, 2026September 16, 2026 by Silicon Curve Research
Silicon Curve data report: The Electricity Rate Gap by State: 51 Jurisdictions Ranked

New York’s electricity rate spread ran 184.5% on trailing 12-month prices through June 2026, against a 102.7% U.S. benchmark. Who it lands on.

Categories Energy Markets

Pennsylvania Generation Flat at 0.3% as PJM Core Diverges

October 16, 2026August 15, 2026 by Silicon Curve Research
Silicon Curve data report: PJM Generation Growth: Four States Diverge

Pennsylvania generation grew just 0.3% over the 12 months through February 2026 while the rest of the PJM core ran ahead of the 1.9% U.S. rate.
Categories Grid Infrastructure

Ohio’s residential electricity prices reached 19.49 ¢/kWh

October 16, 2026August 11, 2026 by Silicon Curve Research
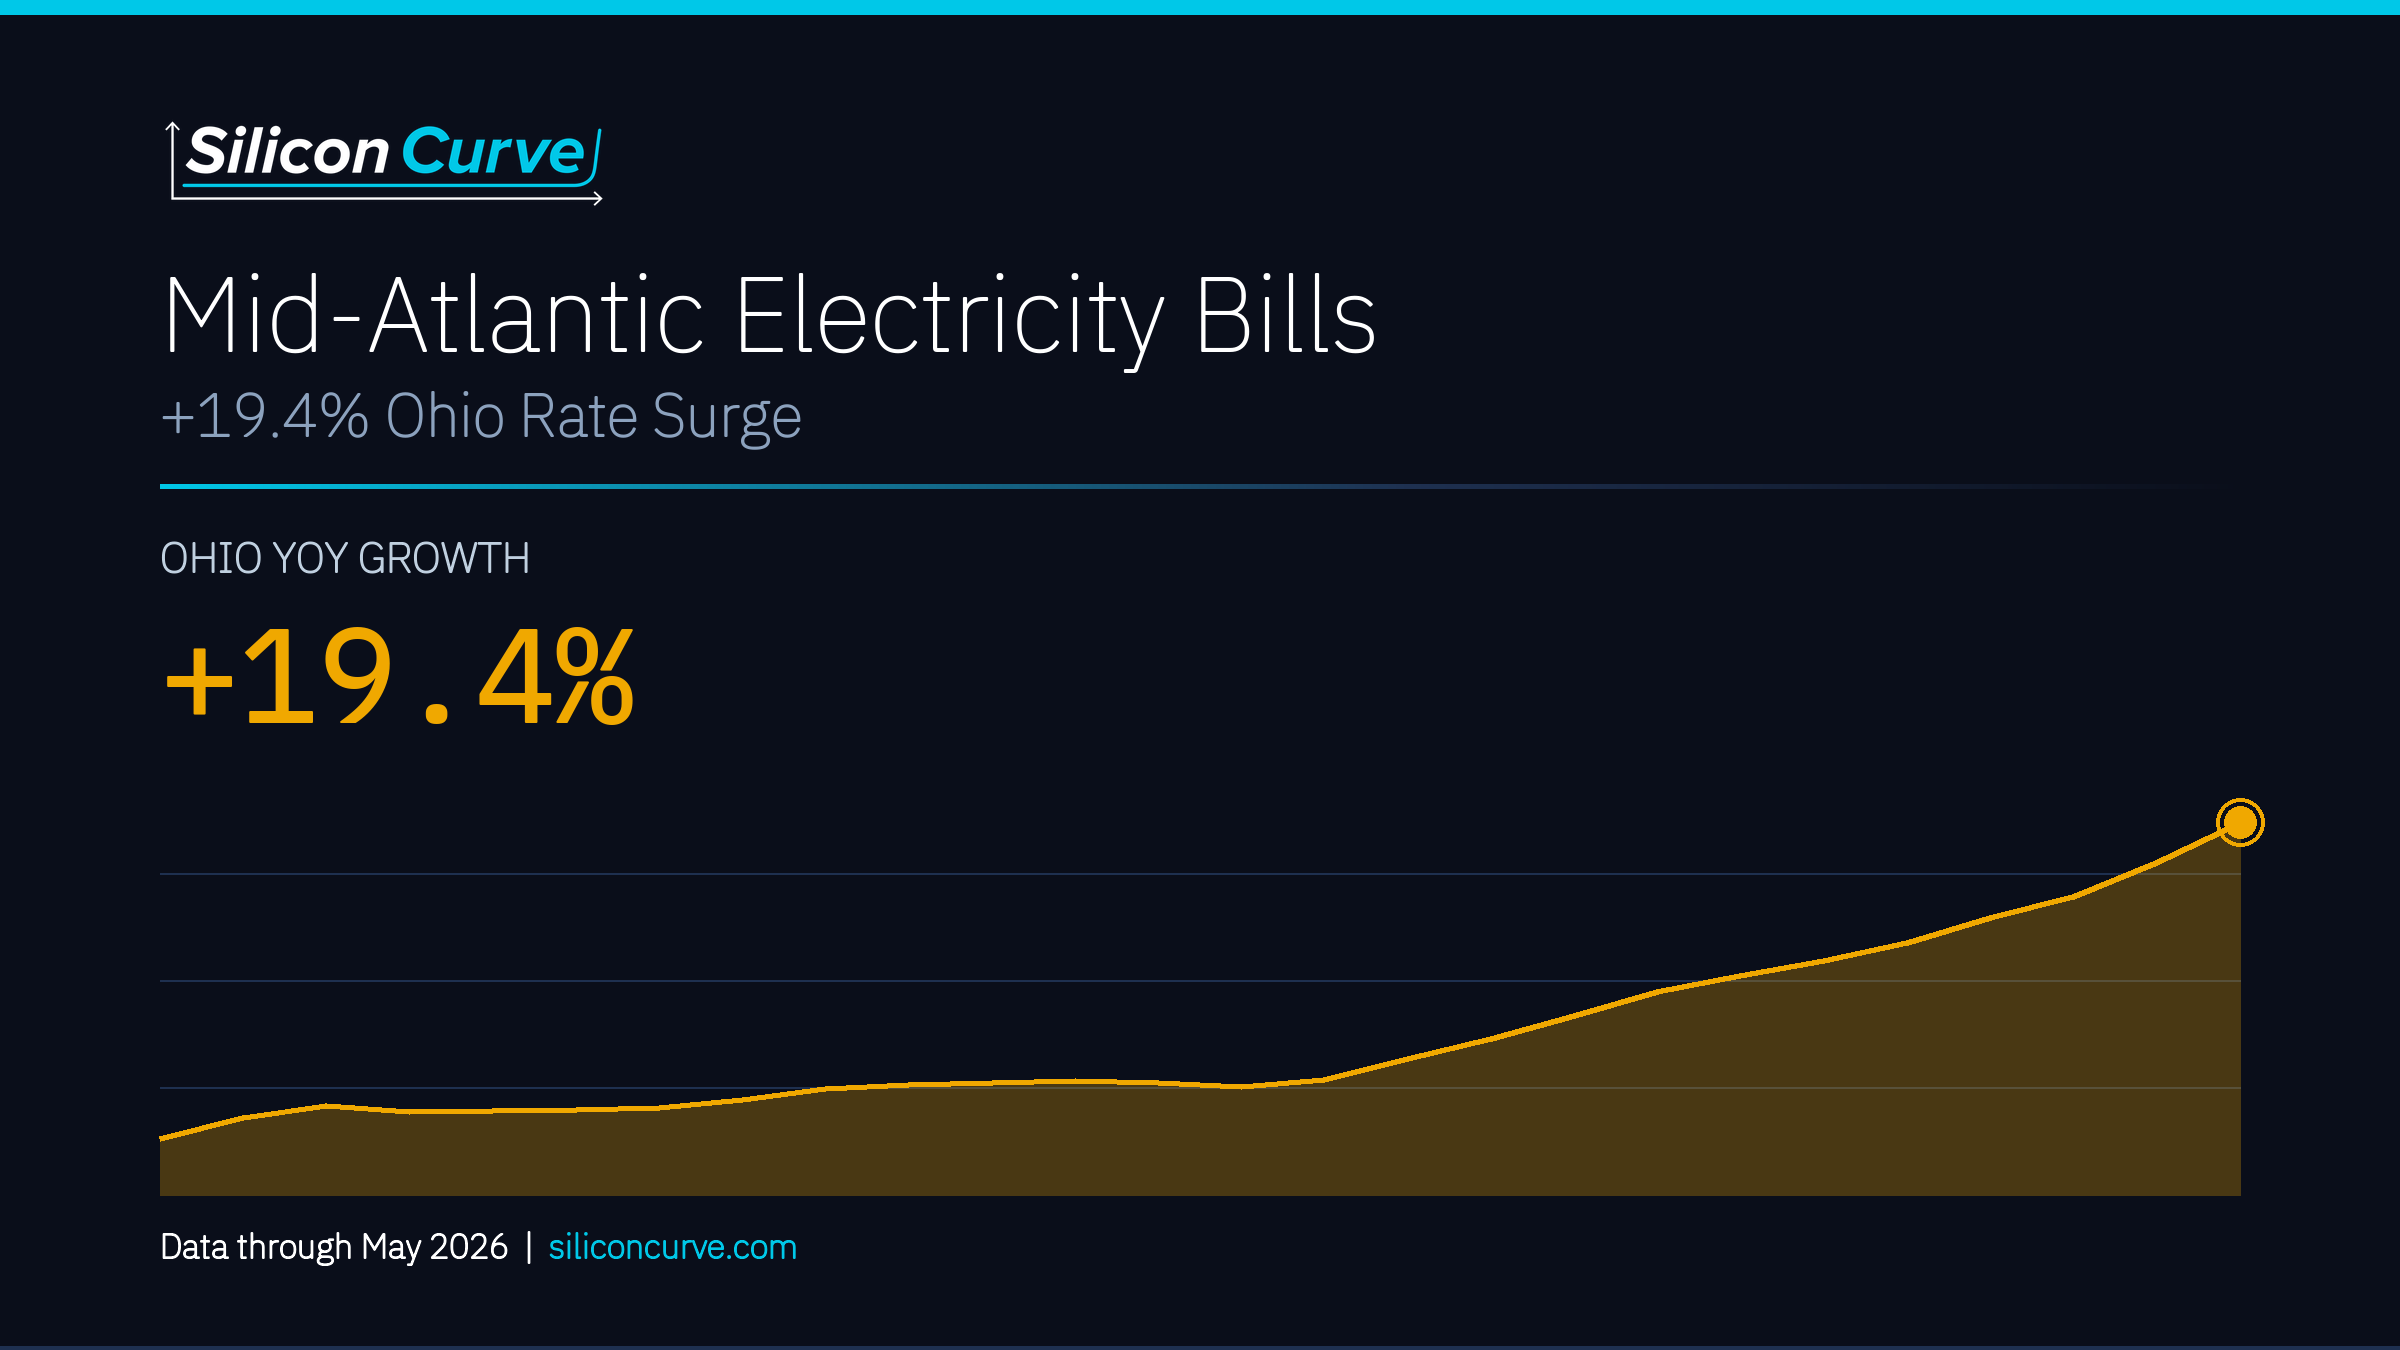
Silicon Curve data report - Mid-Atlantic Electricity Bills: +19.4% Ohio Rate Surge

Ohio residential electricity prices reached 19.49 ¢/kWh in April 2026, up 19.4% year over year. What the household-industrial split means for the PJM core.

Categories Energy Markets

Virginia Industrial Electricity Rates Run Above the National Average

October 16, 2026August 9, 2026 by Silicon Curve Research
Silicon Curve data report: The Electricity Rate-Class Spread: What Households, Businesses and Data Centers Pay

AI data center electricity data through December 2025 shows Virginia’s rate-class spread at 63.3%, the narrowest of three geographies, against 137.9% in Texas.
Categories Energy Markets

Nuclear Baseload Power: 786 TWh Against Solar’s 313 TWh

October 16, 2026August 4, 2026 by Silicon Curve Research
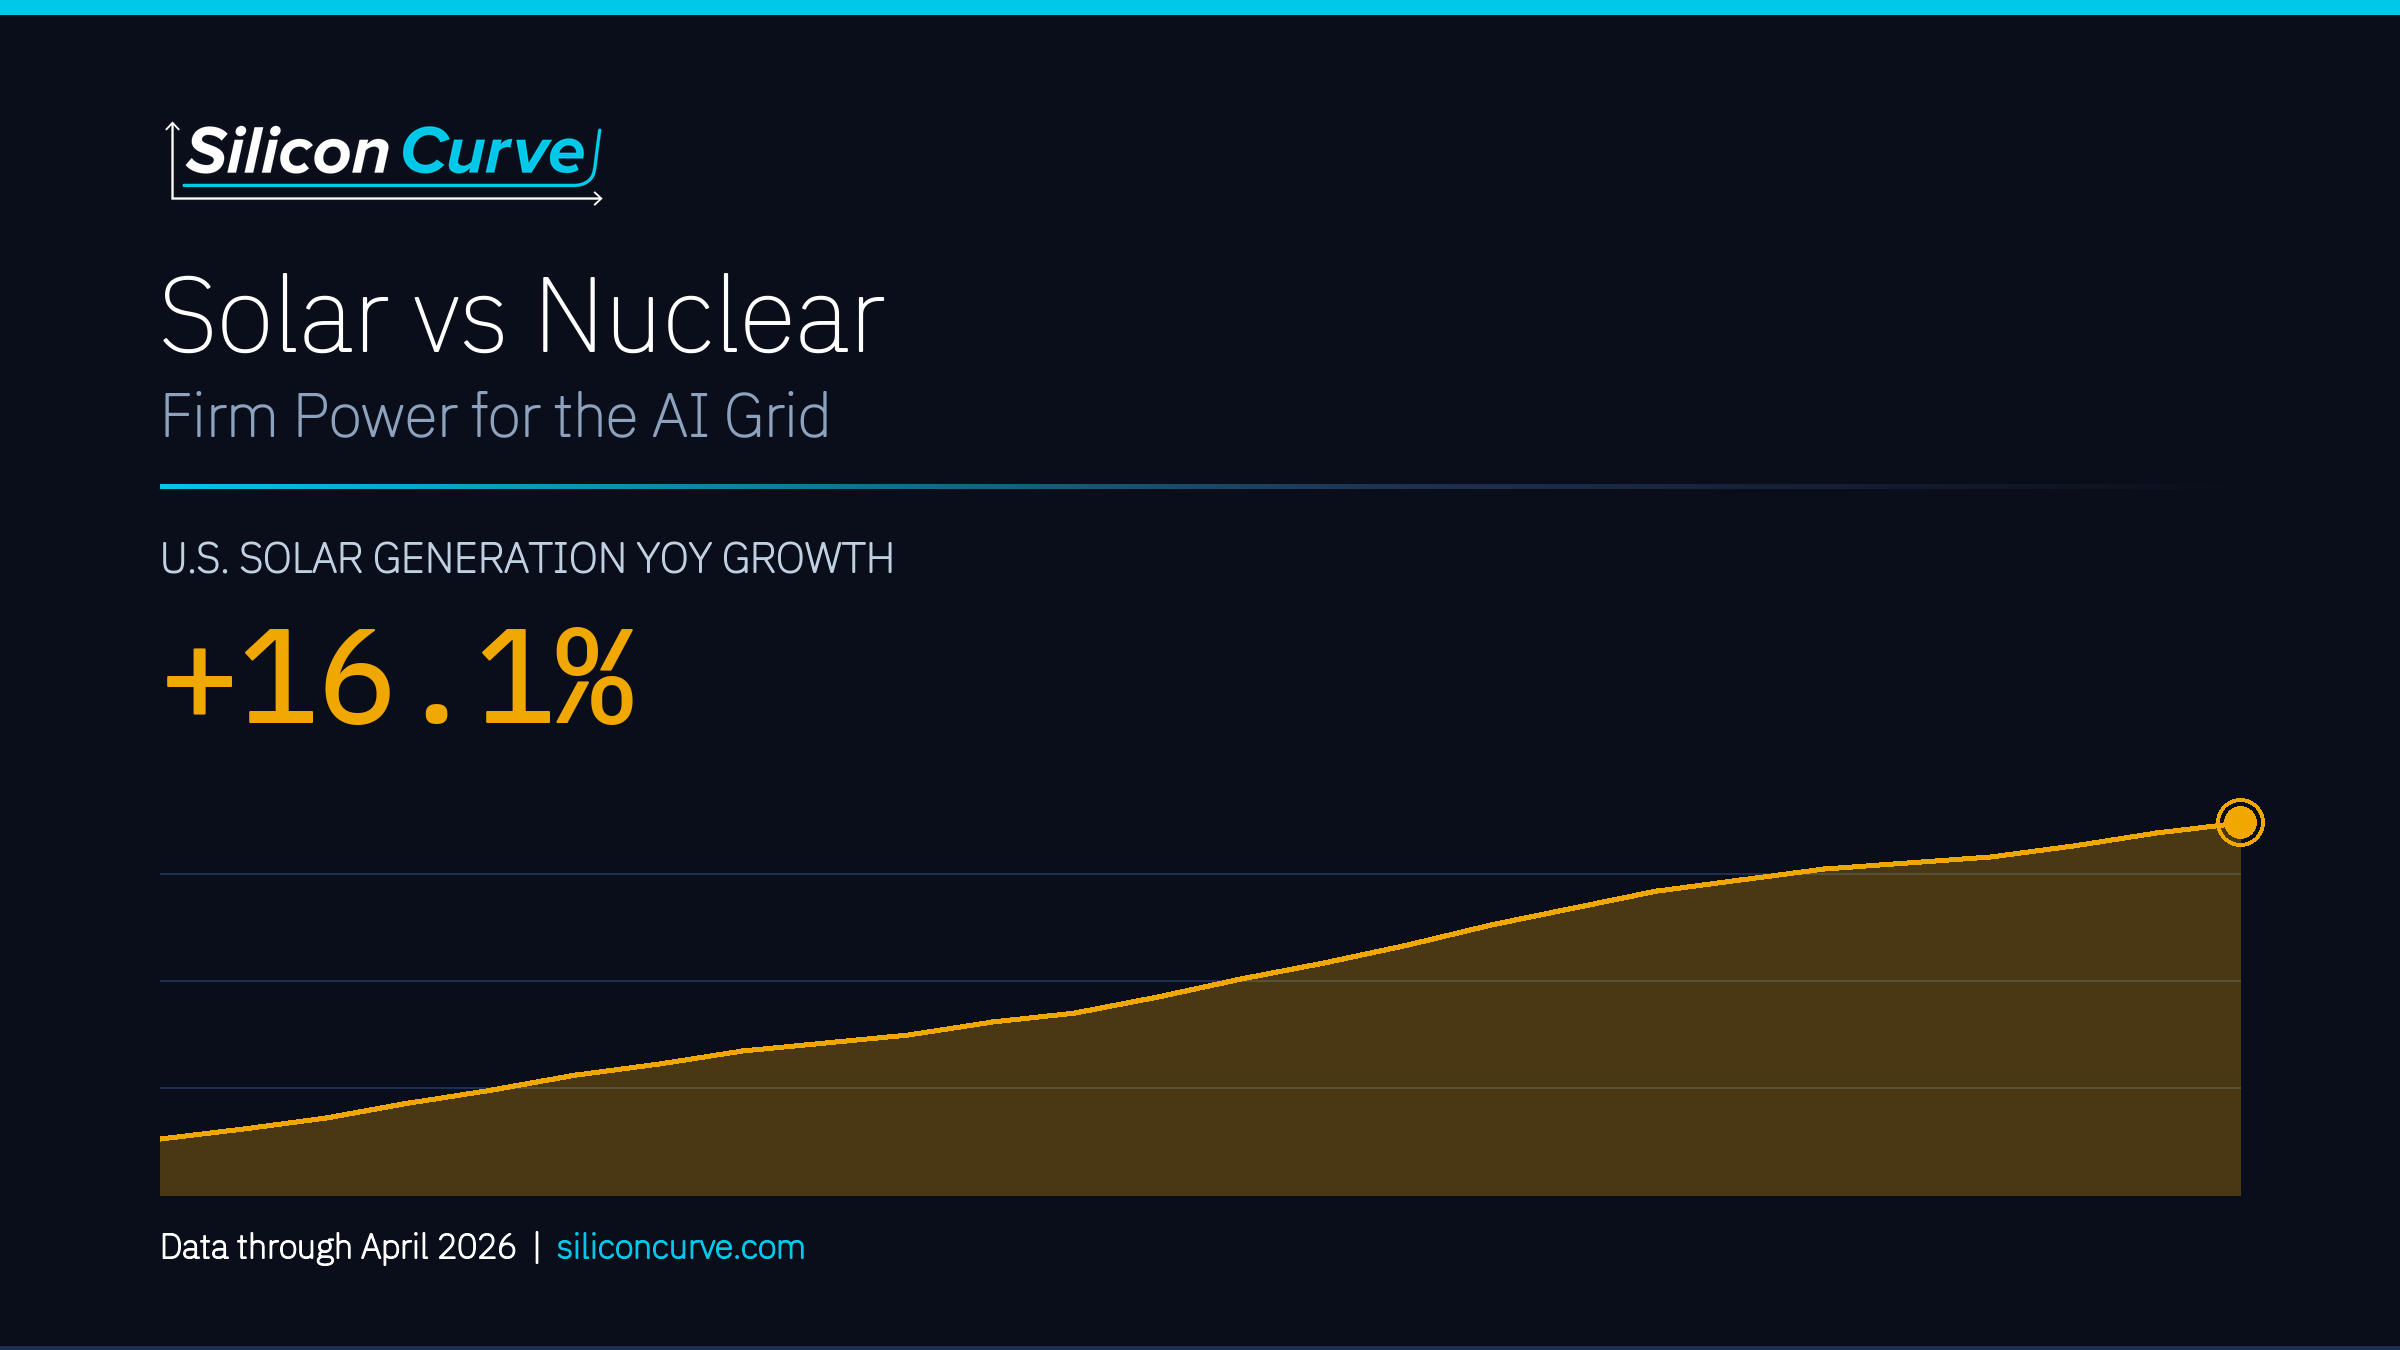
Silicon Curve data report - Solar vs Nuclear: Firm Power for the AI Grid

AI data center electricity comes down to firmness: 786.0 TWh of nuclear vs 313.1 TWh of solar over the 12 months through April 2026, with solar up 16.1%.
Categories Grid Infrastructure

US Electricity Supply Growth: 4,429.5 TWh and 8.53 Cents/kWh

August 9, 2026July 25, 2026 by Silicon Curve Research
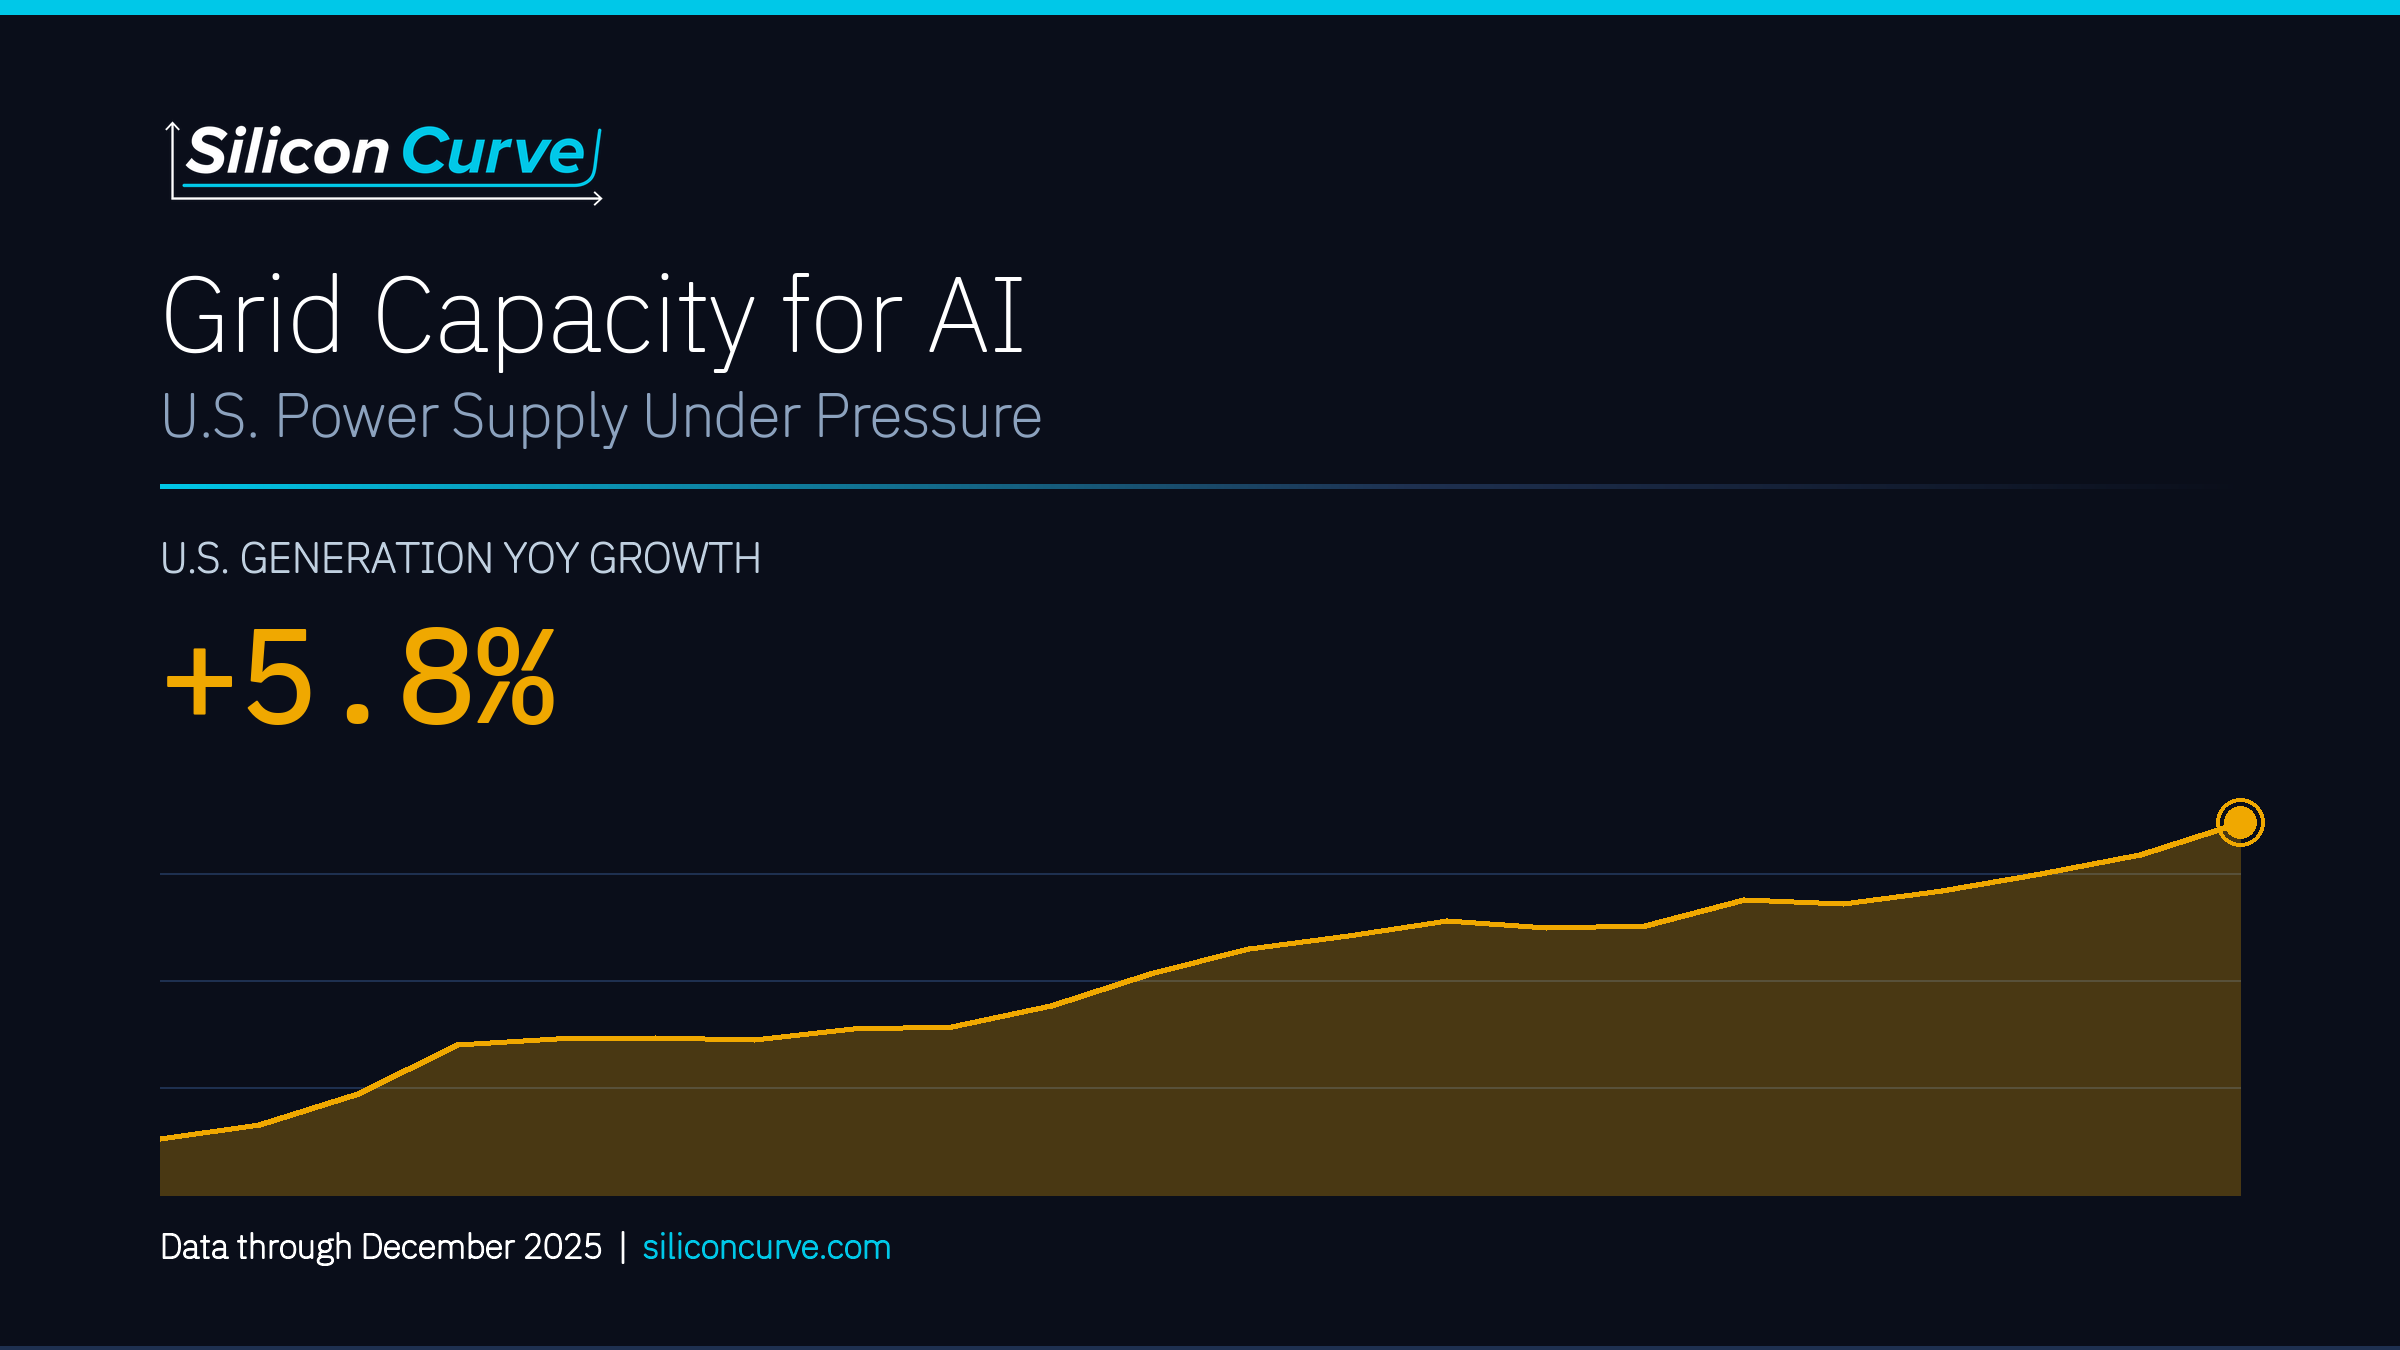
Silicon Curve data report - Grid Capacity for AI: U.S. Power Supply Under Pressure

Grid capacity for AI in the federal data: U.S. generation hit 4,429.5 TWh over 12 months while industrial rates rose to 8.53 cents/kWh. EIA data through Dec 2025.
Categories Grid Infrastructure

The AI Data Center Electricity Story in Federal Data

October 16, 2026July 20, 2026 by Silicon Curve Research
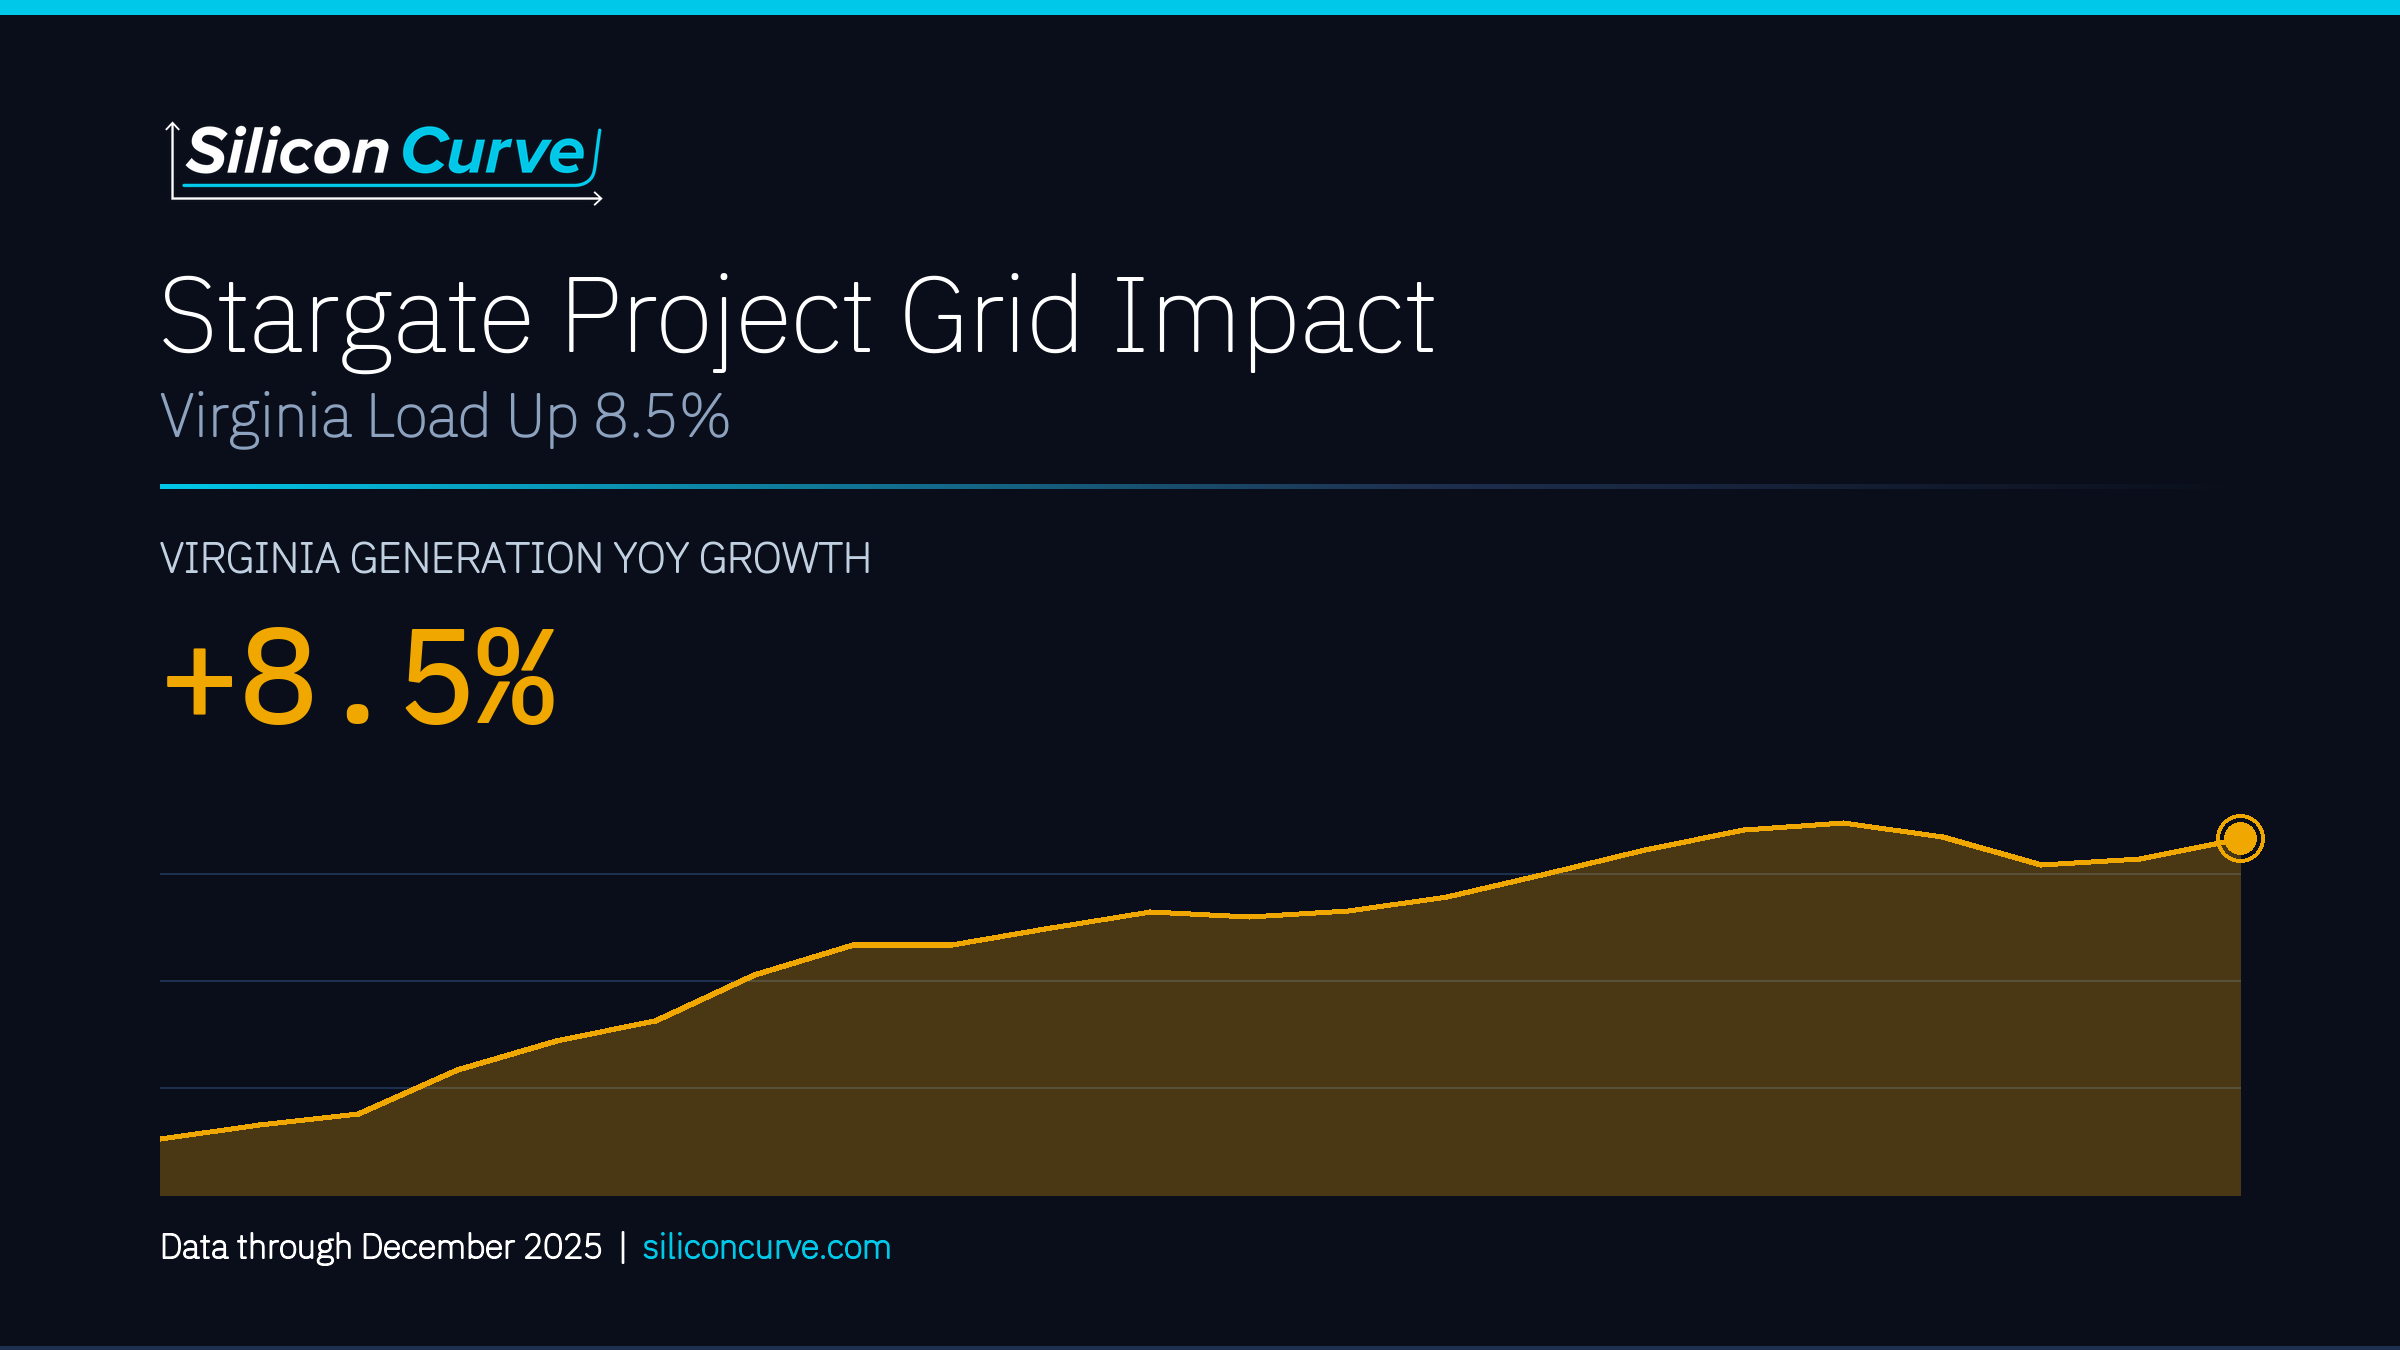
Silicon Curve data report - Stargate Project Grid Impact: Virginia Load Up 8.5%

What the AI data center electricity signal actually looks like in EIA and FRED data through December 2025, from Virginia generation growth to gas prices.

Categories Grid Infrastructure
Follow the Research
  • LinkedIn
  • Facebook
  • Instagram
  • TikTok
  • X
  • YouTube
  • Mail
© 2026 Silicon Curve | All data sourced from U.S. federal agencies | Not investment advice.
Terms & Conditions | Privacy Policy