Pennsylvania Generation Flat at 0.3% as PJM Core Diverges
Pennsylvania generation grew just 0.3% over the 12 months through February 2026 while the rest of the PJM core ran ahead of the 1.9% U.S. rate.
Silicon Curve briefs are AI infrastructure commentary: short, opinionated reads on what we noticed in the federal electricity data and why we think it matters. They are written alongside our research reports, not in place of them. A brief carries the argument. The report carries the evidence.
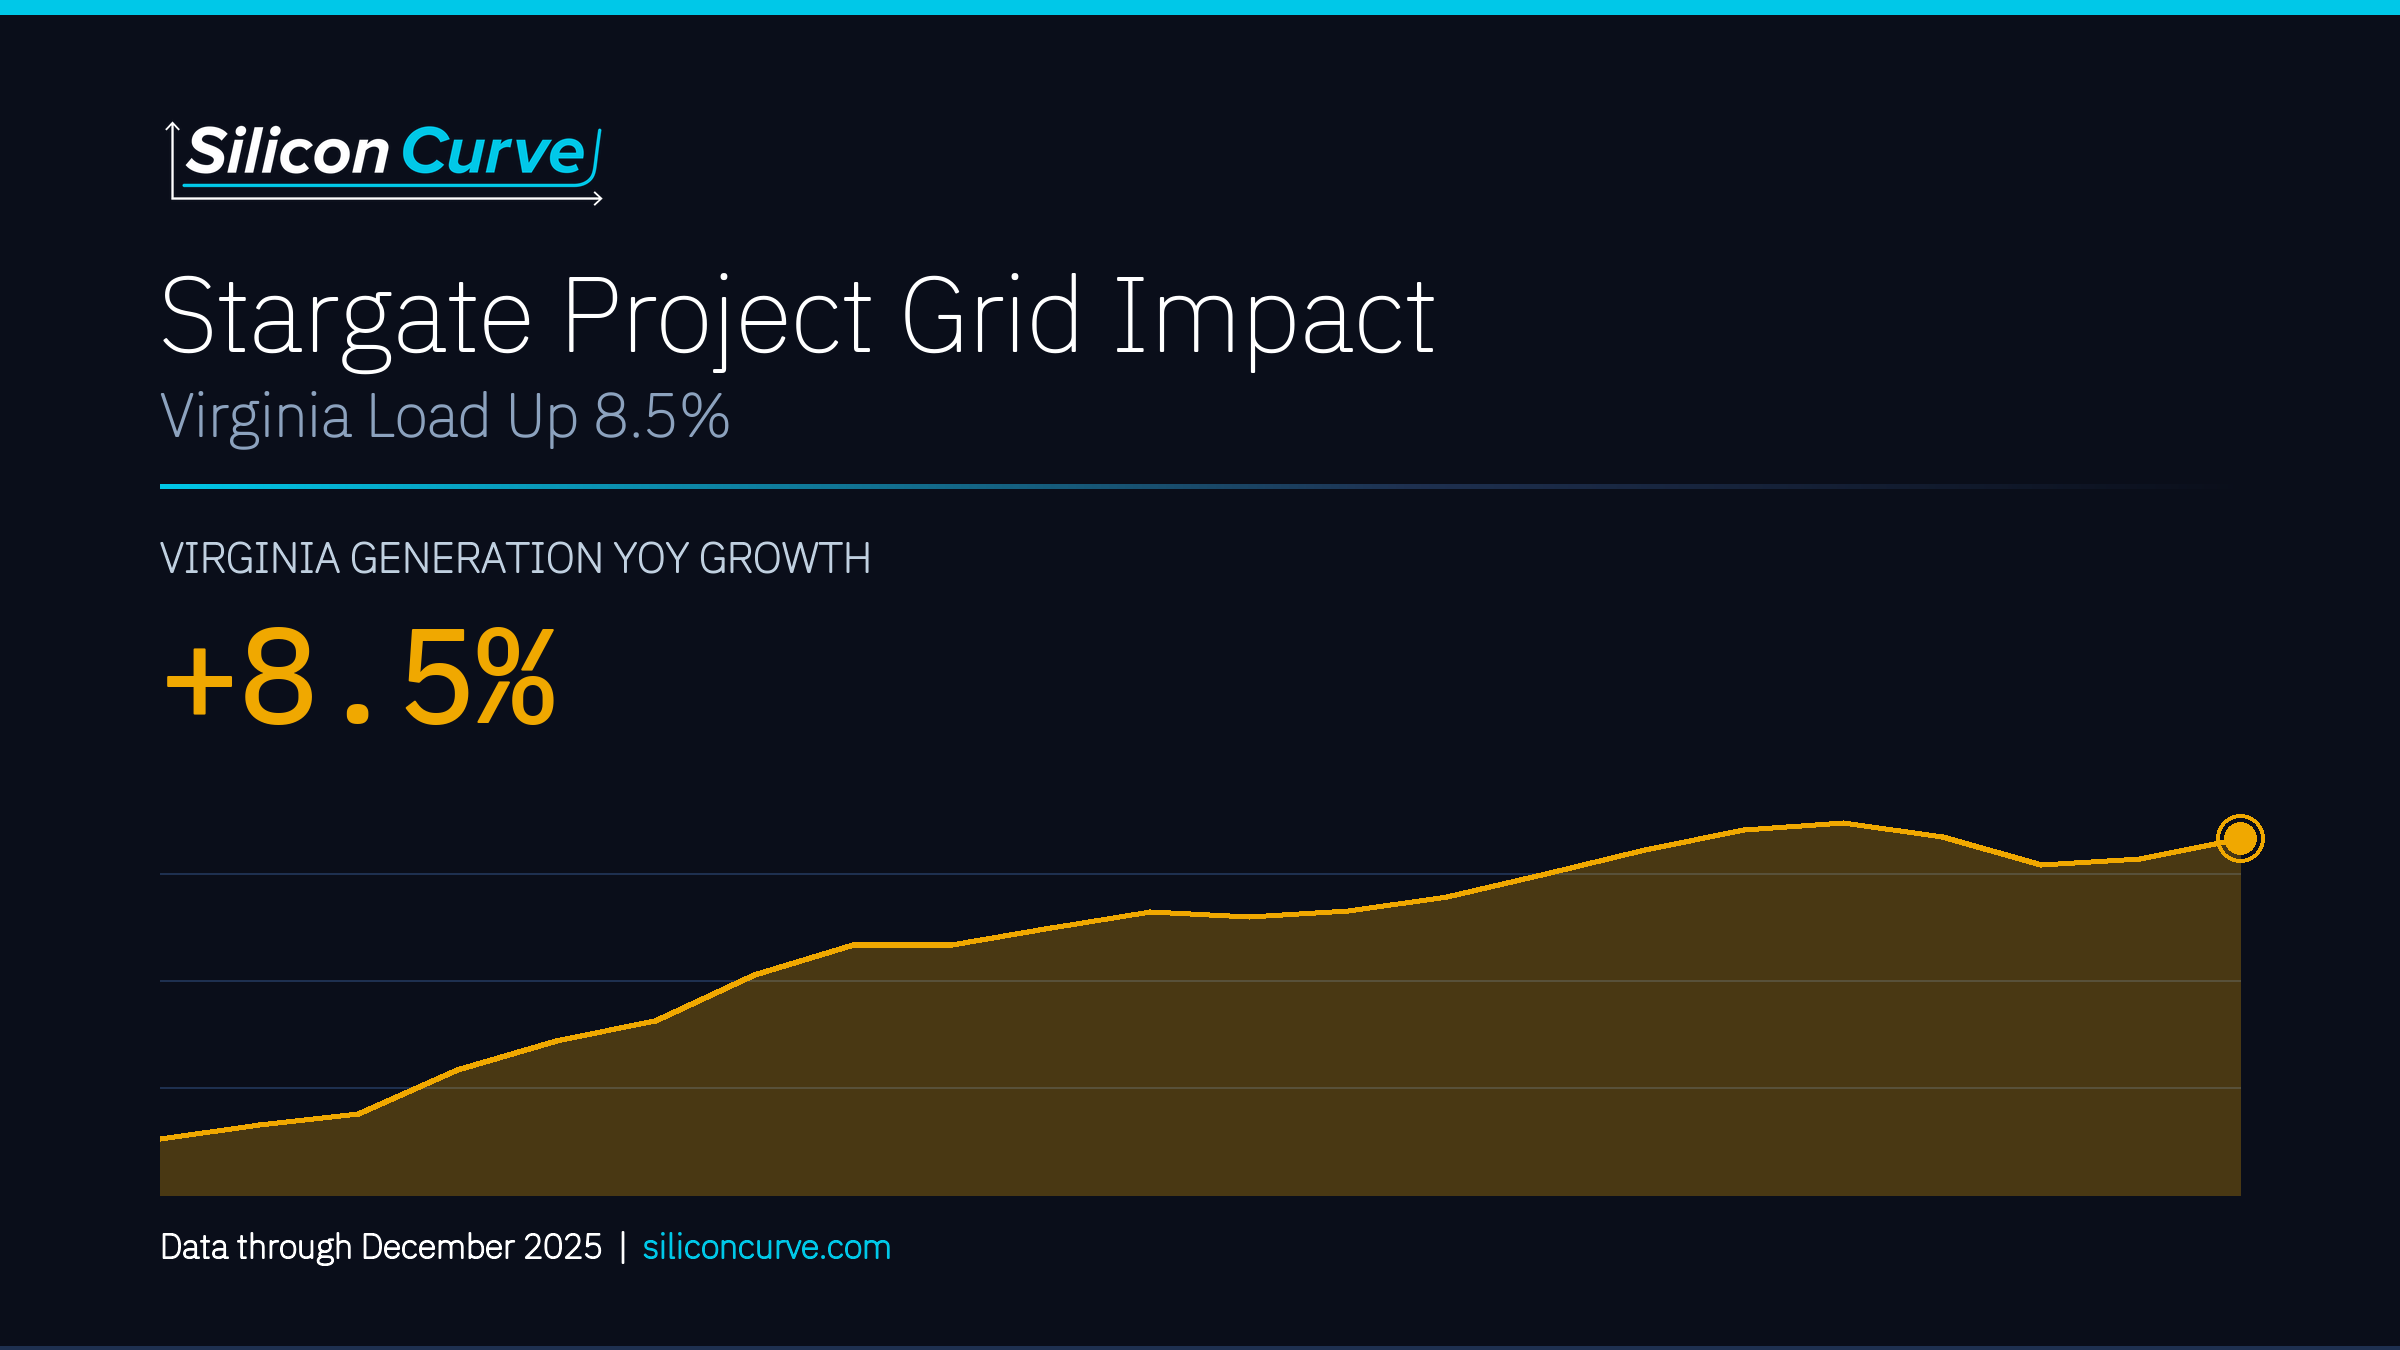
Each brief takes one question from a published report and answers it in a few minutes. The series-level detail behind it, every figure traced to a named EIA or FRED release, the full methodology, the source tables and the charts, lives in the research report itself. Briefs published so far cover the firmness gap between nuclear and solar generation, national generation volume against industrial rates, and the Virginia demand signal behind the data center build-out.
Pennsylvania generation grew just 0.3% over the 12 months through February 2026 while the rest of the PJM core ran ahead of the 1.9% U.S. rate.
Ohio residential electricity prices reached 19.49 ¢/kWh in April 2026, up 19.4% year over year. What the household-industrial split means for the PJM core.
AI data center electricity data through December 2025 shows Virginia’s rate-class spread at 63.3%, the narrowest of three geographies, against 137.9% in Texas.
AI data center electricity comes down to firmness: 786.0 TWh of nuclear vs 313.1 TWh of solar over the 12 months through April 2026, with solar up 16.1%.
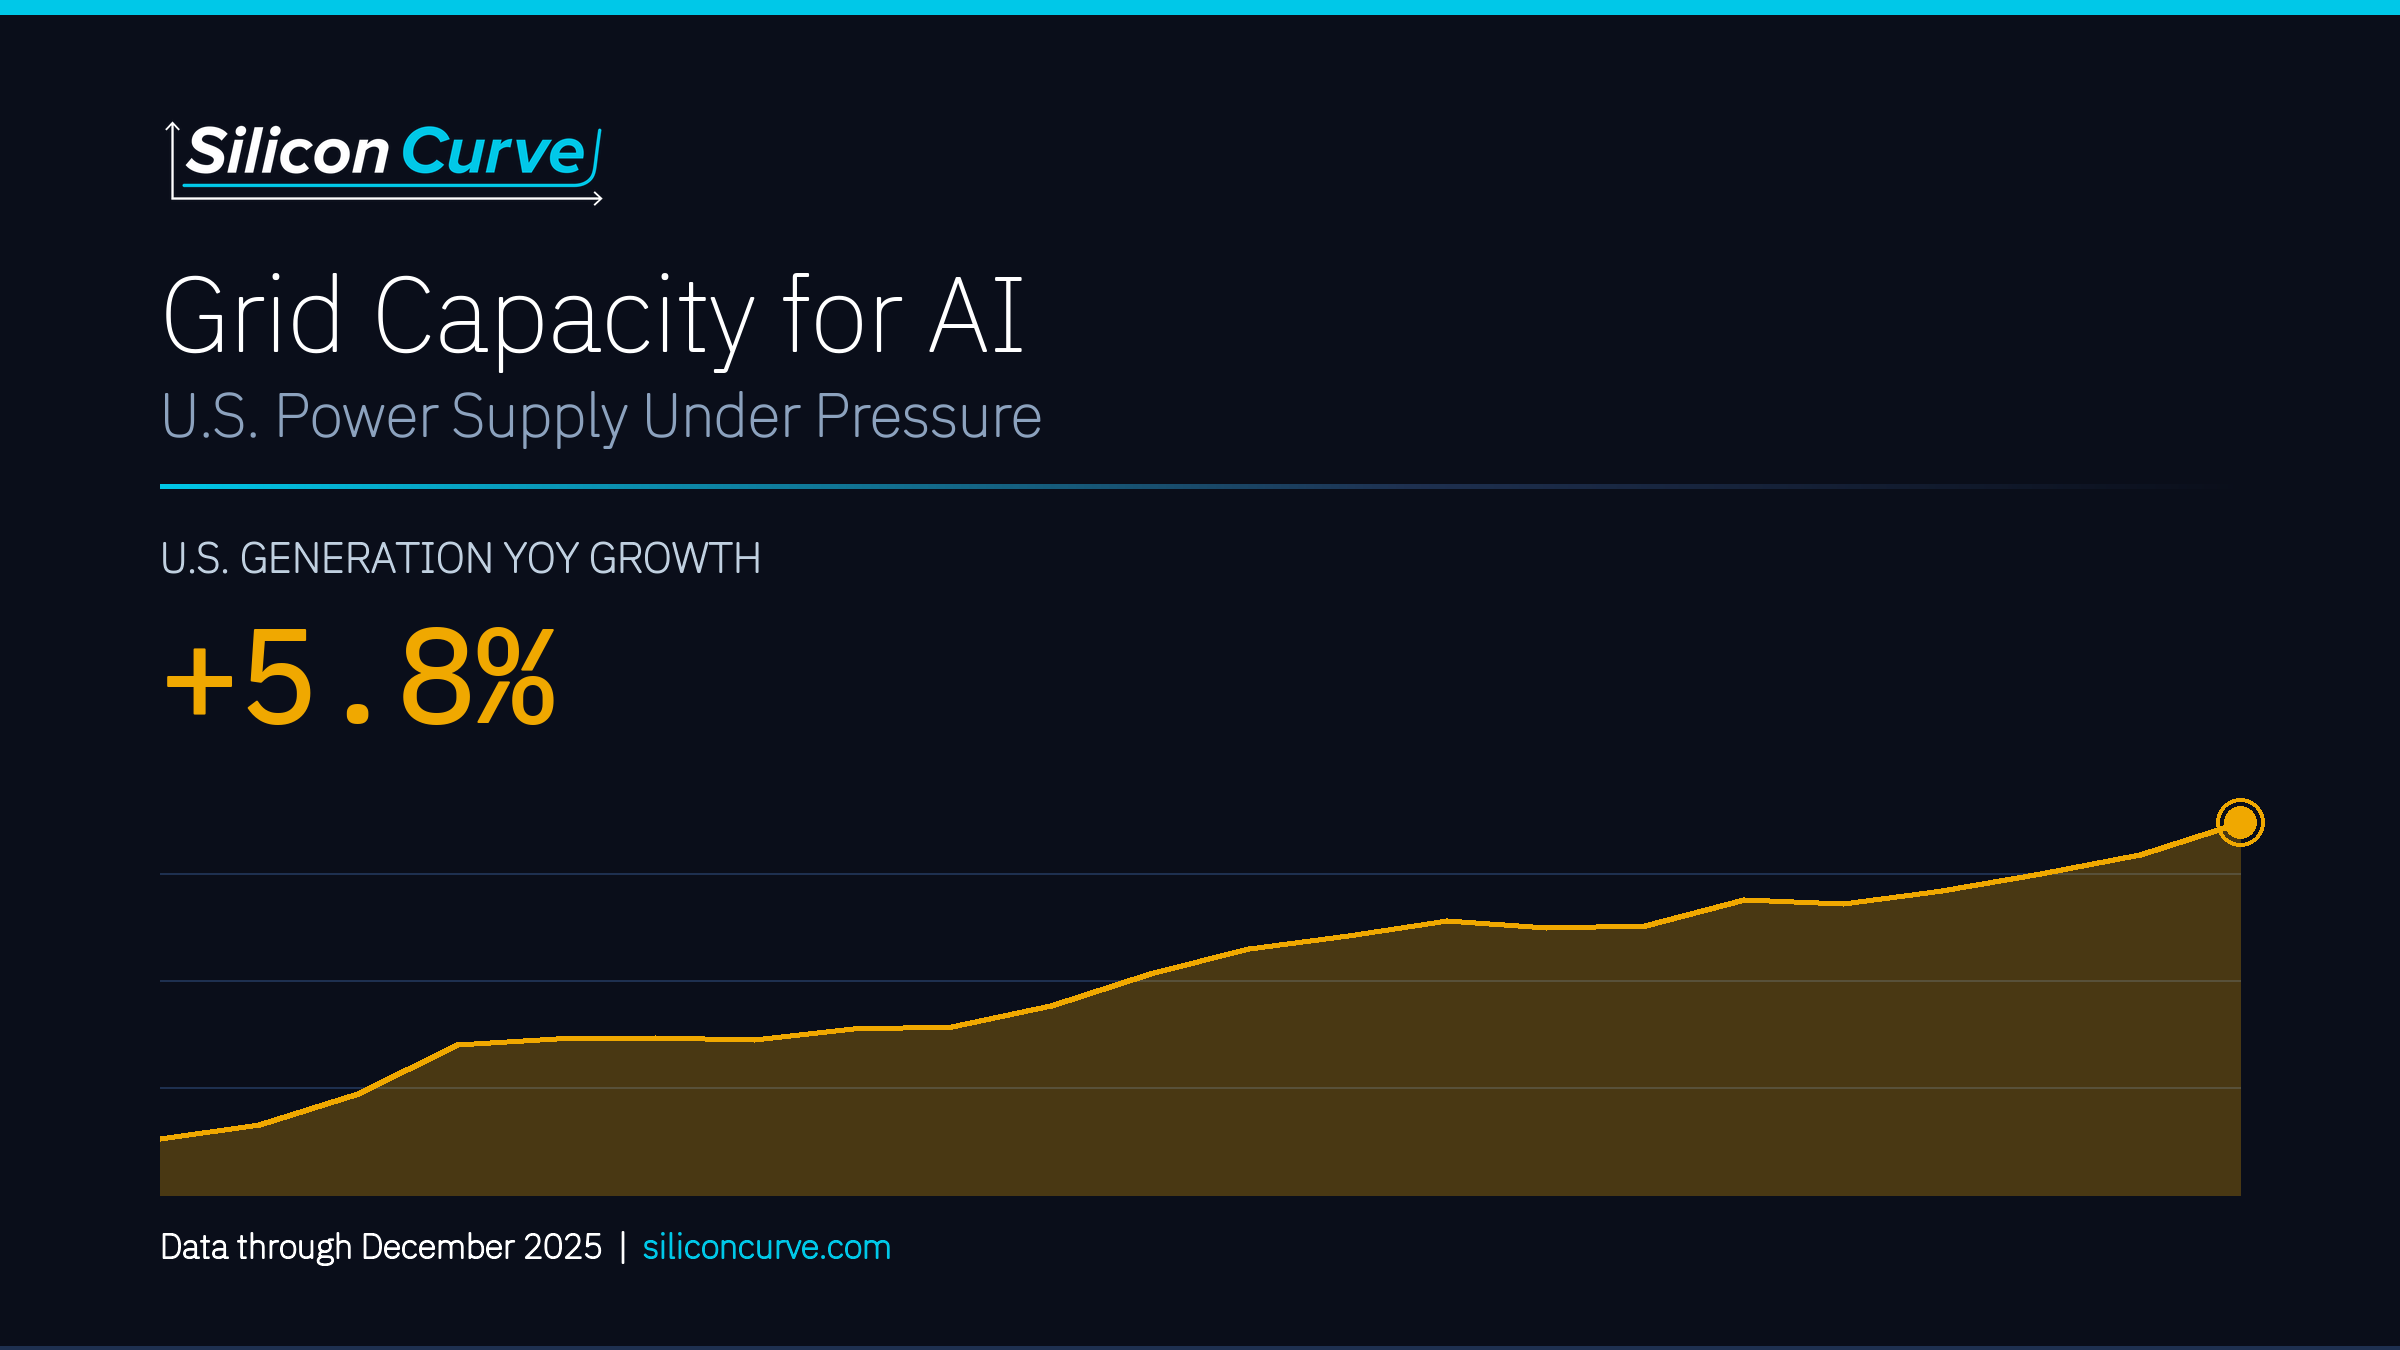
Grid capacity for AI in the federal data: U.S. generation hit 4,429.5 TWh over 12 months while industrial rates rose to 8.53 cents/kWh. EIA data through Dec 2025.

What the AI data center electricity signal actually looks like in EIA and FRED data through December 2025, from Virginia generation growth to gas prices.