
TL;DR
- 446.3 TWh in July 2025: the single highest month of U.S. net generation in the dataset window.
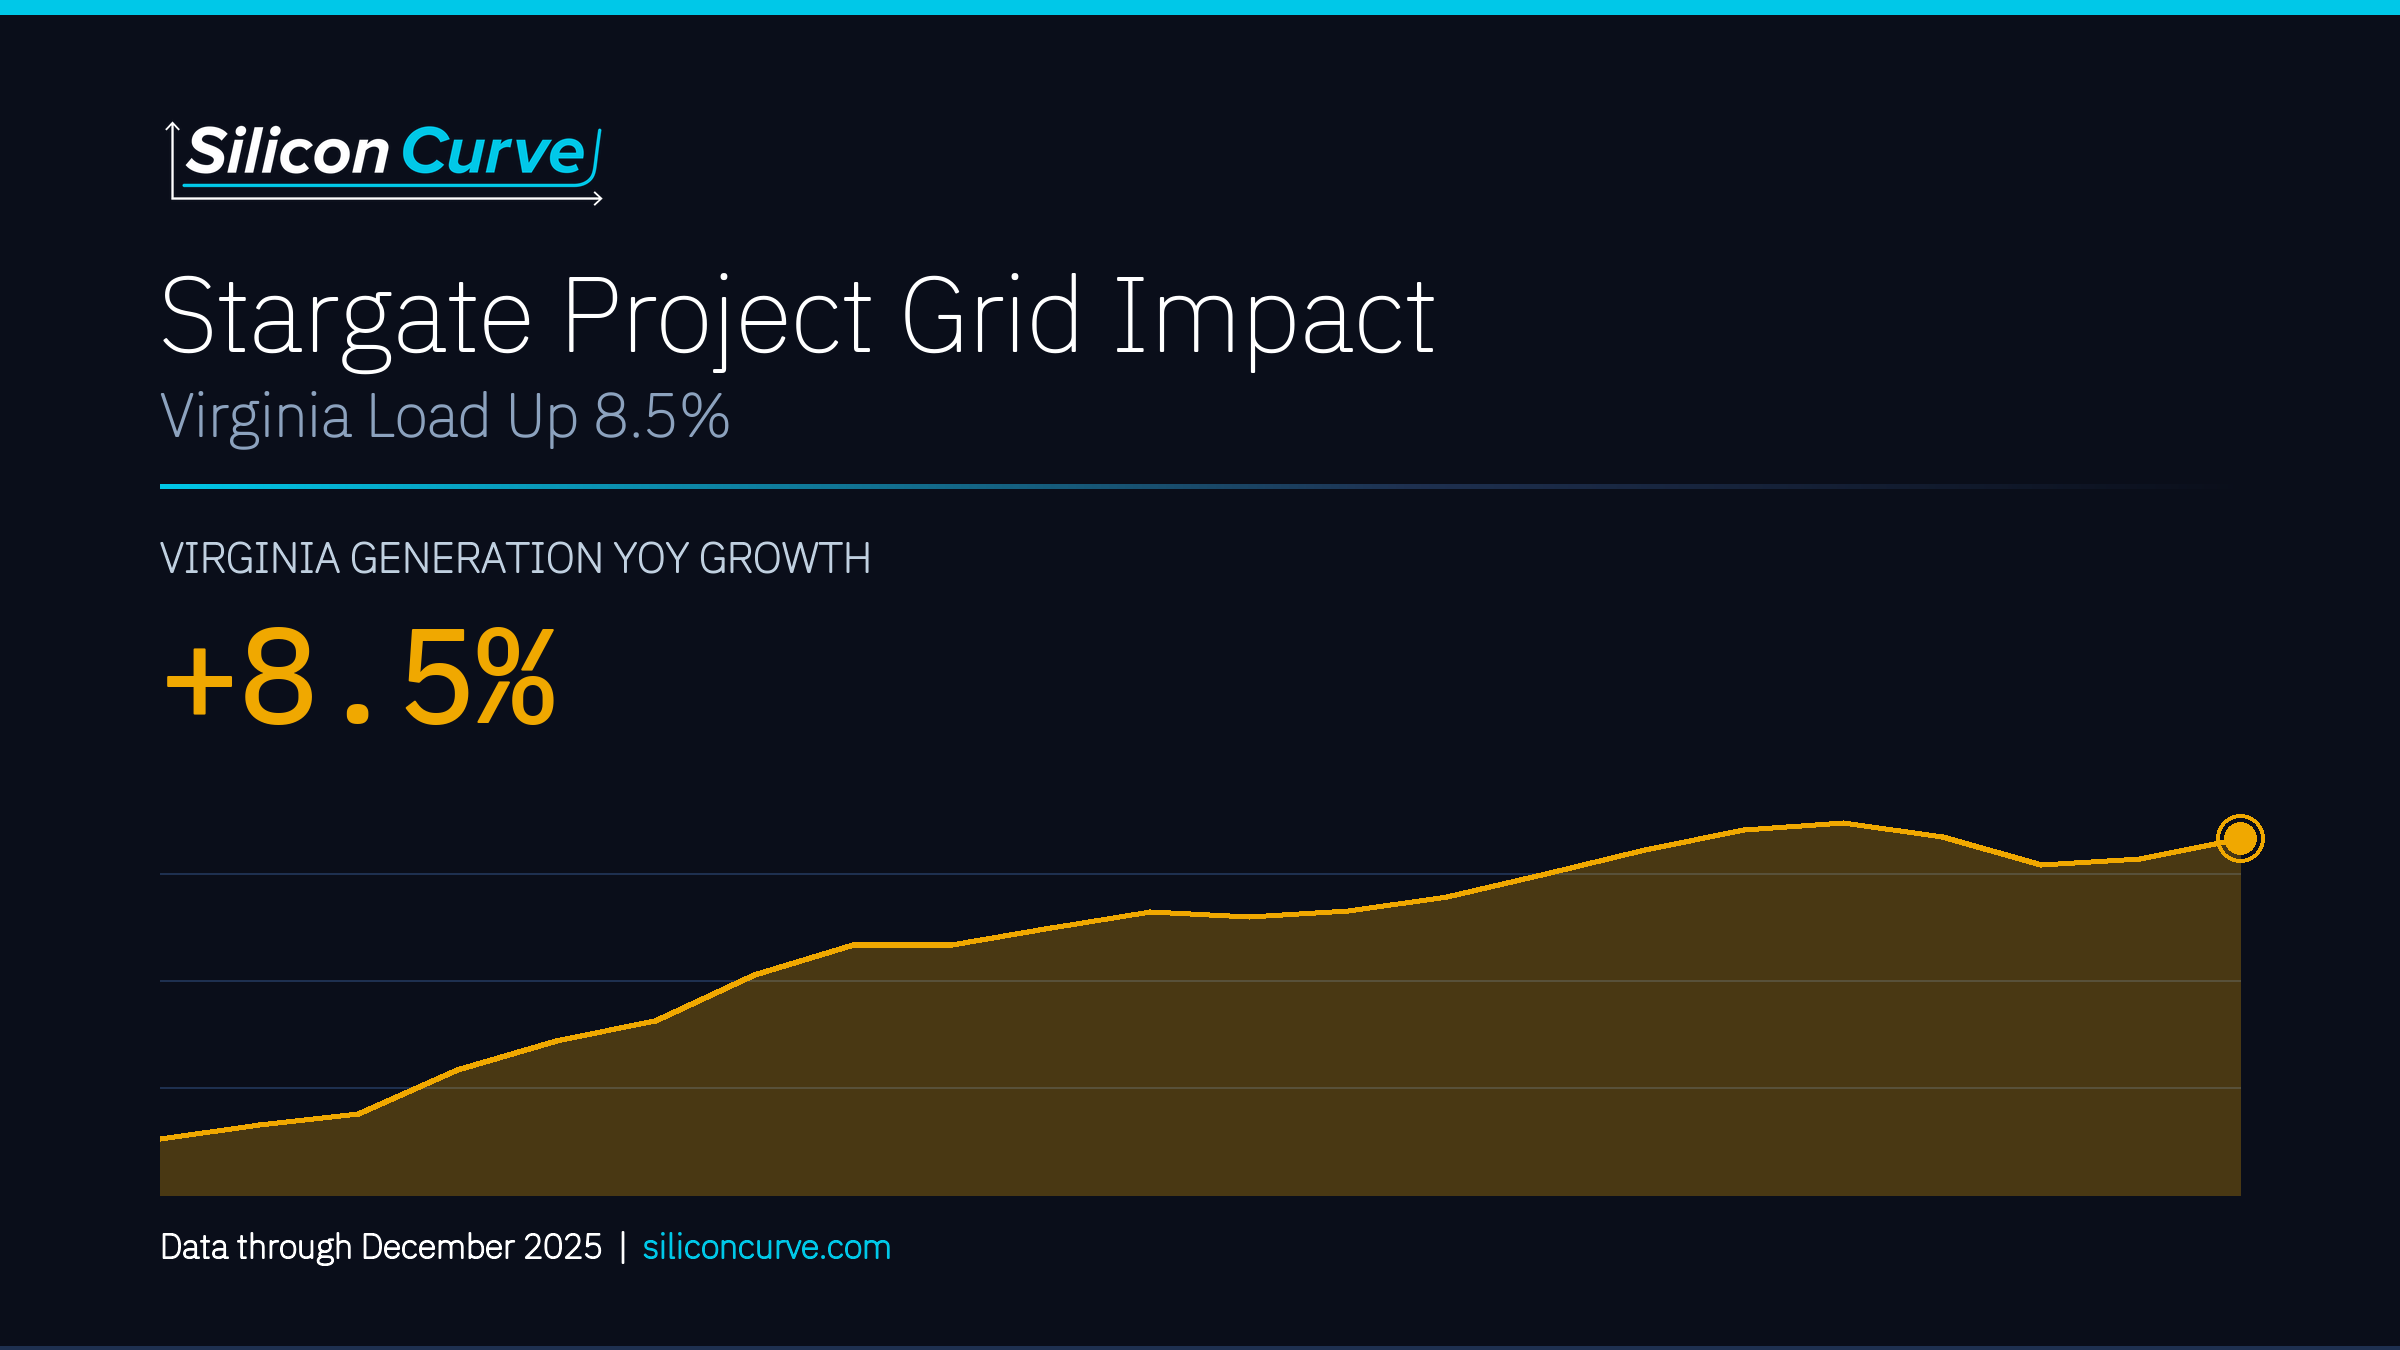
- 8.5% year over year (December 2025): Virginia’s total generation growth, the sharpest of the states we track.
- $4.26/MMBtu in December 2025: Henry Hub natural gas at a window high, up 41.5% year over year.
- 4.67% in Q4 2025: IT equipment and software as a share of U.S. GDP.
We have spent a lot of time this month staring at the AI data center electricity numbers, and we want to walk through what actually shows up versus what people assume shows up. EIA data through December 2025.
Is the buildout showing up in the national data?
Yes, in the sense that the totals are big and getting bigger. U.S. net generation hit 446.3 TWh in July 2025, the highest single month in the window, and the 12 months through December 2025 summed to 4,429.5 TWh. Our read: the national line is real but blunt. It cannot tell you a single kilowatt-hour came from a compute campus. It just tells you the country is generating more, which is consistent with, not proof of, the story everyone wants to tell.
You can pull the national genera2025, and the state produced 106.0 TWh over the 12 months through December 2025. That is the number that makes us lean in. Northern Virginia is the densest data center corridor in the country, so we think it is fair to say the growth tracks with that load expansion. But we want to be careful with our own language here: tracks with is not the same as caused by. The federal series does not isolate data center consumption from everything else happening on that grid.
Virginia at 8.5% year over year is the closest thing to a fingerprint we can find in this data, and even that is an inference.
What about Texas, home of the flagship campus?
Texas grew too, just more quietly in the fuel mix. Natural gas supplied 46.6% of December 2025 generation, with wind at 25.4% and solar at 7.7%. What strikes us is how diversified the ERCOT picture looks compared to the assumption that gas simply carries everything. Texas solar was up 37.8% year over year in December 2025. Our honest opinion: the Texas grid is a more interesting reliability story than the headlines suggest, because the load growth is landing on a mix that keeps shifting.
Are prices telling the same story?
Partly. Henry Hub natural gas reached $4.26/MMBtu in December 2025, a window high and up 41.5% year over year from $3.01/MMBtu. On the retail side, U.S. industrial electricity prices, the tier that matters most for hyperscale facilities, hit 9.33 cents/kWh nationally in July 2025, the highest in the dataset. We think the temptation is to draw a straight line from AI load to your power bill. We would resist it. Retail prices move on inflation, fuel costs, and utility capital cycles all at once. The dataset does show a moderate correlation (r = 0.59) between Henry Hub and industrial prices at a six-month lag, which is interesting but not a causal claim.
Does the macro picture back any of this up?
It rhymes with it. IT equipment and software reached 4.67% of U.S. GDP in Q4 2025, with private IT investment at $1,466.4B (SAAR). That is an economy-wide aggregate, not a Stargate line item, so we treat it as mood music rather than evidence. Still, when generation, prices, and IT investment all drift up in the same window, the pattern is at least internally consistent.
Our take: the data does not prove the AI buildout is reshaping the grid yet, but nothing in it argues against the thesis either.
So what do we actually believe?
Here is our read after living in these series. The AI data center electricity narrative is directionally supported by federal data, with Virginia as the clearest case and Texas as the most nuanced one. What the data cannot do is hand you causation, and anyone who tells you otherwise is selling something. We would rather show you the record generation month, the 8.5% Virginia number, and the gas benchmark, and let you decide how much weight the inference carries.
If you want the full build, including the fuel-mix breakdowns and the price-lag analysis, that is where the report goes deep.