
Stargate Project Grid Impact: Reading the AI Buildout in Federal Energy Data
U.S. net electricity generation reached 446.3 TWh in July 2025, the highest single month in the dataset window, as Virginia and Texas, the two states most tied to the AI compute buildout, posted 8.5% and 5.0% year-over-year generation growth.
This report examines the Stargate Project grid impact through the lens of U.S. federal energy data, tracing whether the announced AI data center buildout is yet visible in official generation, price, and investment series through December 2025. Rather than restate announced capacity or dollar figures, we anchor the analysis in what the U.S. Energy Information Administration (EIA), the Federal Reserve Economic Data (FRED) system, and the Bureau of Economic Analysis (BEA) have already recorded. The flagship Stargate campus in Abilene, Texas, draws on the Electric Reliability Council of Texas (ERCOT) grid, while Northern Virginia's data center concentration sits within the PJM Interconnection (PJM).
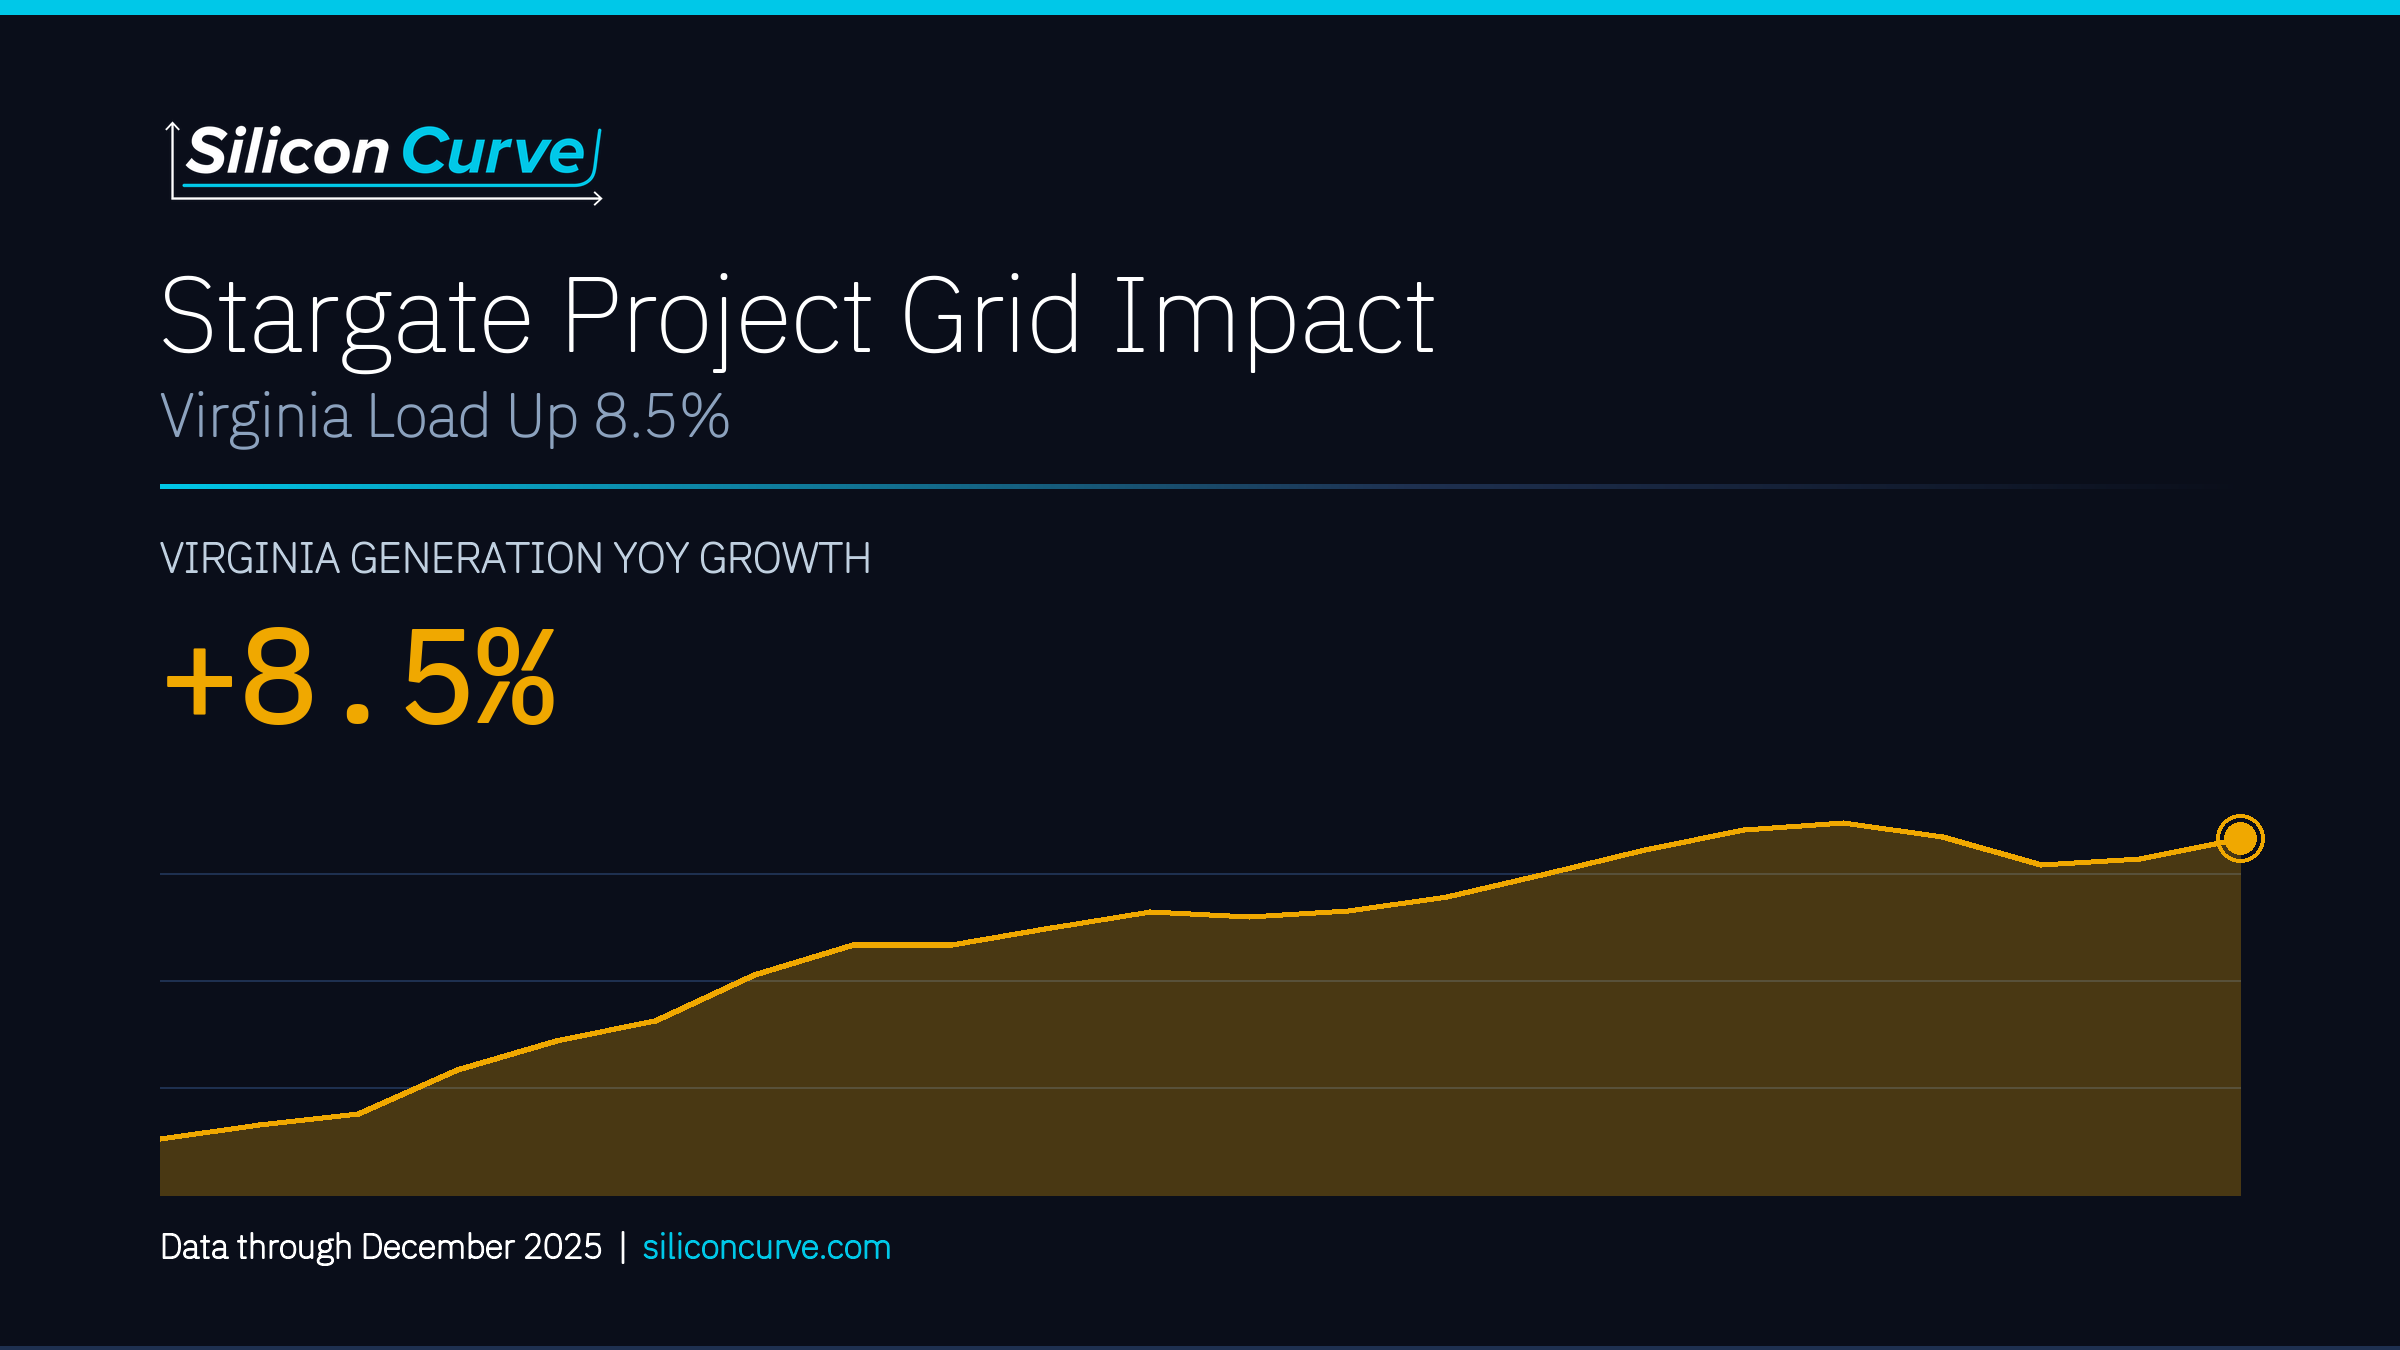
Over the 12 months through December 2025, U.S. net electricity generation totaled 4,429.5 TWh. Virginia generated 106.0 TWh over the same period and Texas generated 590.9 TWh. National generation increased 5.8% year-over-year in December 2025, with Virginia at 8.5% and Texas at 5.0%, elevated demand growth in Virginia by the Silicon Curve threshold framework. Virginia's growth is consistent with sustained data center load expansion in the Northern Virginia corridor, though this framing is an inference rather than a direct measurement.
On the cost side, the natural gas benchmark and retail electricity prices both moved higher into the end of the window. Henry Hub reached $4.26/MMBtu in December 2025. Industrial electricity prices, the relevant tier for hyperscale facilities, reached 9.33 cents per kWh nationally in July 2025, the highest monthly value in the dataset. Economy-wide IT investment, an aggregate BEA measure spanning information processing equipment and software rather than any single project, reached $1,466.4B (SAAR) in Q4 2025.
Federal data shows elevated generation growth in Virginia (+8.5% YoY) and steady expansion in Texas (+5.0% YoY) alongside a broad rise in industrial electricity and natural gas prices, a pattern consistent with, but not proof of, the AI infrastructure buildout beginning to register in official grid statistics. Retail price increases reflect multiple factors including general inflation, fuel costs, and utility capital cycles, and should not be attributed to a single cause.
National net electricity generation across all sectors and fuels, the denominator for all state-level comparisons; July 2025 recorded the window's single-month peak of 446.3 TWh.
Virginia's total generation rose by 0.7 TWh in December 2025 versus the prior year, qualifying as elevated demand growth and consistent with Northern Virginia data center load expansion.
The natural gas benchmark reached its highest monthly value in the window, up 41.5% year-over-year from $3.01/MMBtu, a fuel-cost signal with pass-through implications for electricity.
The state fuel-mix data frames how each grid meets rising load. In Virginia, natural gas supplied 63.6% of December 2025 generation while nuclear supplied 22.5%; Virginia solar generation totaled 9.1 TWh over the 12-month window. In Texas, natural gas supplied 46.6% of December 2025 generation, wind 25.4%, and solar 7.7%, with Texas solar generation up 37.8% year-over-year in December 2025. The dataset shows a moderate positive correlation (r = 0.59) between Henry Hub prices and U.S. industrial electricity prices at a six-month lag; correlation does not establish causation. Texas market structure varies by service territory, and ERCOT retail competition mechanics should not be generalized to all Texas locations.
State generation growth and commercial sales cannot isolate data center consumption from other activity, and none of these federal series is project-specific. Summer electricity price peaks are driven by multiple factors and should not be labeled as caused by AI load without supporting data.
TABLE OF CONTENTS
- Executive SummaryFree
- National Grid Baseline🔒
- Virginia Load Growth🔒
- Texas Load and ERCOT Stress🔒
- Virginia Fuel Mix🔒
- Texas Fuel Mix🔒
- Industrial and Retail Prices🔒
- Natural Gas Cost Environment🔒
- IT Investment Context🔒
- The Bottom Line🔒
- Data Appendix🔒
- Endnotes🔒
- U.S. Energy Information Administration
- Federal Reserve Bank of St. Louis / BEA
- Federal Reserve Bank of St. Louis / EIA
Unlock the Full Report
The full report details national and state-level generation baselines, Virginia and Texas load growth and fuel mix, industrial and retail price trends, the natural gas cost environment, and economy-wide IT investment context, all traced to EIA, FRED, and BEA series through December 2025.
Unlock This Report for Only $49