
TL;DR
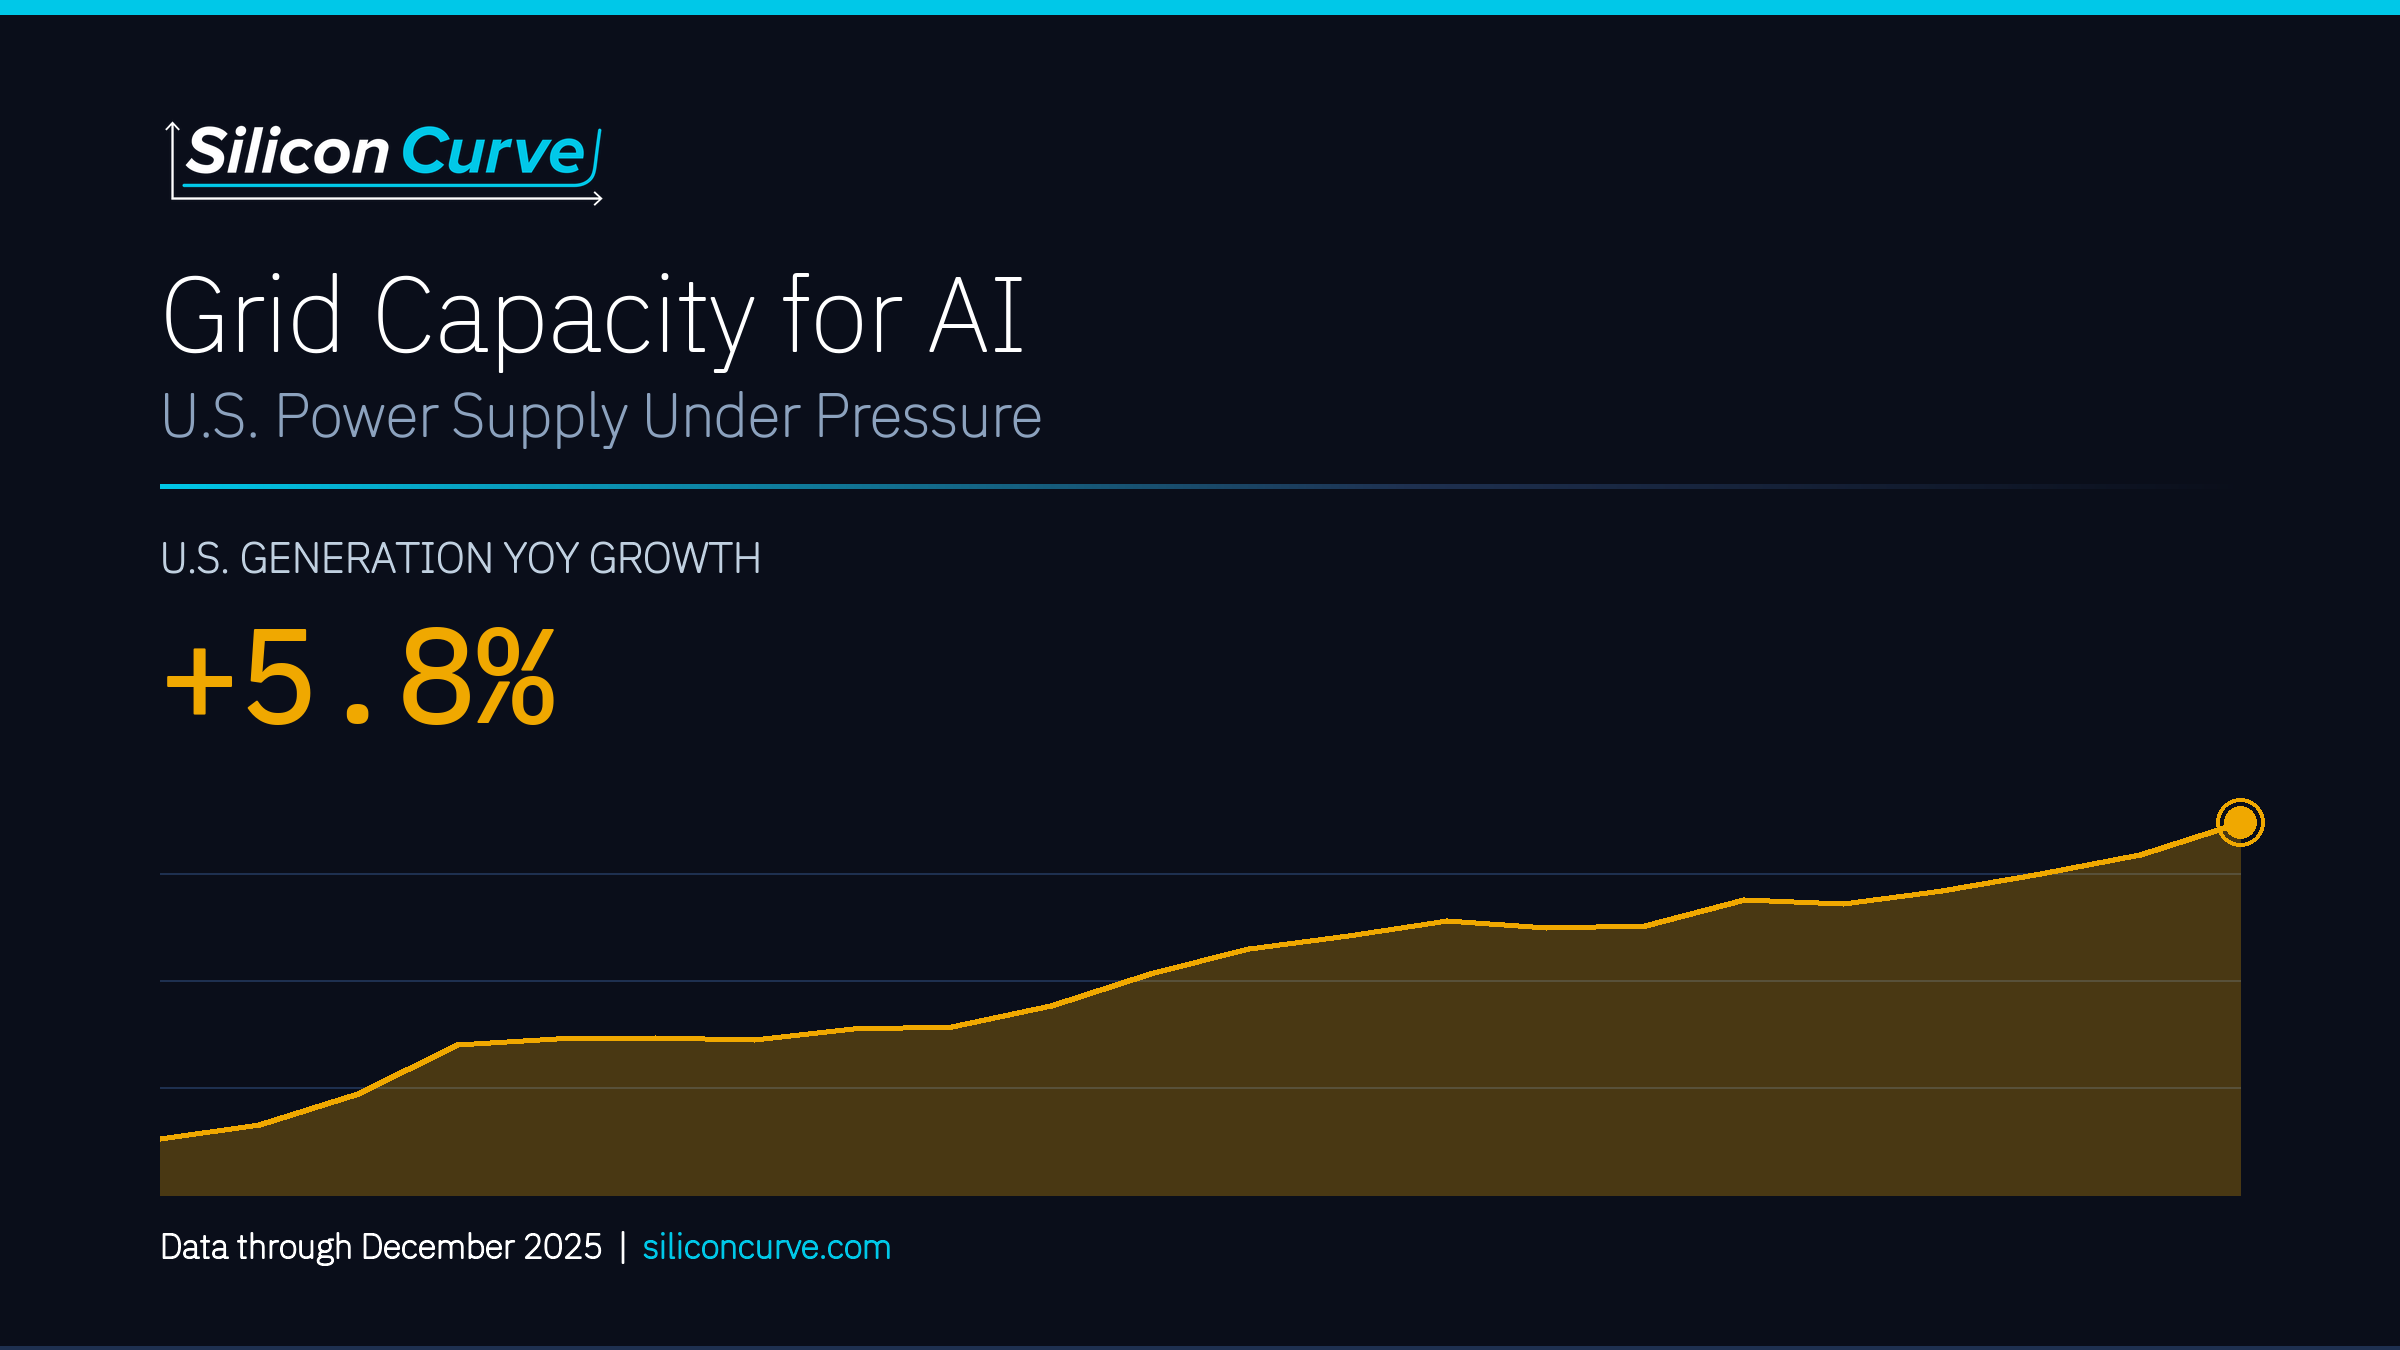
- 4,429.5 TWh: total U.S. net generation over the 12 months through December 2025, with December output up 5.8% year over year. The question of grid capacity for AI has moved from forecast to measured trend.
- +22.2%: solar’s year-over-year change in December 2025, far outpacing nuclear’s 1.9%.
- 8.53 cents/kWh: the national average industrial electricity price in December 2025, up from 7.96 a year earlier.
- $1,466.4B: private fixed investment in IT equipment and software in Q4 2025, up 19.5% year over year (economy-wide, not data-center-specific).
EIA data through December 2025.
Is the buildout showing up in the data?
Yes. U.S. net electricity generation totaled 4,429.5 TWh over the 12 months through December 2025, and December output was 5.8% above December 2024. After roughly two decades of essentially flat U.S. electricity demand, load is growing again alongside a wave of announced compute projects. Our read: this is the first stretch in a long time where the grid capacity for AI conversation has hard federal numbers behind it instead of vendor slides.
We do want to hold the caution line here. Peak monthly output in the 33-month window hit 446.3 TWh in July 2025 against a trough of 301.9 TWh in April 2023. Generation swings seasonally with summer cooling load and maintenance. A single month is a data point, not a structural verdict. You can pull the series yourself from the EIA electricity data browser.
Which fuels are actually carrying the growth?
Solar is the sprinter. Solar net generation grew 22.2% year over year in December 2025, reaching 15.4 TWh versus 12.6 TWh a year earlier. Nuclear grew 1.9% over the same span, reaching 72.5 TWh.
That gap is not a contest so much as two different jobs. Nuclear behaves like near-flat baseload, contributing 784.8 TWh over the trailing 12 months with barely any year-over-year move. Solar behaves like a fast-growing but seasonal source: it peaked at 33.4 TWh in July 2025 and totaled 295.7 TWh over the 12 months.
Nuclear holds the floor steady, solar keeps stacking capacity on top. The grid capacity for AI story is really a story about both at once.
Our take: if you only watch the flashy solar growth number, you miss that the baseload underneath it barely moved. Both matter for a demand environment that runs around the clock.
What is grid capacity for AI doing to prices?
Prices are up for large consumers. The national average industrial retail electricity price reached 8.53 cents/kWh in December 2025, up from 7.96 a year earlier, with a 12-month rolling average of 8.61 cents/kWh. That is consistent with a tighter demand environment, but it is not proof of one cause. Retail rates track with general inflation, fuel costs, and utility capital cycles all at once. We are not going to pin it on data centers alone, and neither should anyone selling you a tidy narrative.
Is fuel cost adding noise to the picture?
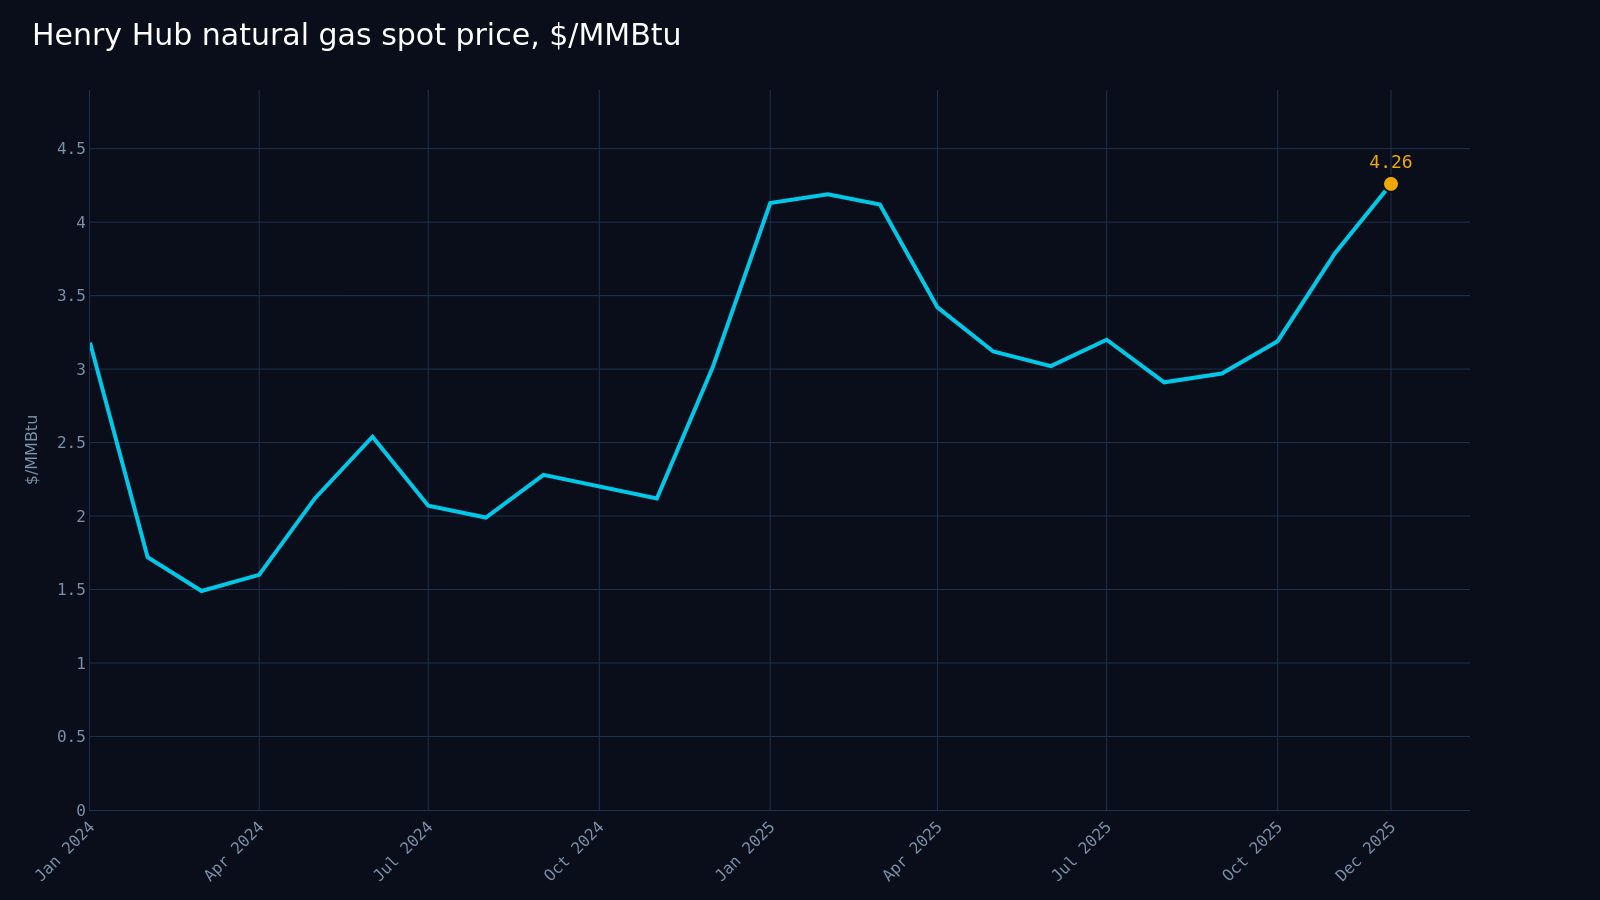
Yes, and December was noisy. The Henry Hub natural gas spot price was $4.26/MMBtu in December 2025, up 41.5% from December 2024. But the 12-month average was a far steadier $3.53/MMBtu. A single-month spike above a calmer annual average is exactly the kind of figure that gets over-quoted. The FRED Henry Hub series makes the volatility obvious at a glance.
Is the capital real?
The capital is large enough to show up in national accounts. Private fixed investment in information processing equipment and software reached $1,466.4B (seasonally adjusted annual rate) in Q4 2025, up 19.5% year over year. We flag this carefully: it is an economy-wide measure of technology capital, not a data-center-specific or company-specific line. We include it only to frame scale. It tracks with a heavy investment cycle; it does not prove where every dollar landed.
So can supply keep pace?
The honest answer is that supply is clearly moving, and large consumers are clearly paying more while it moves. Generation up 5.8% year over year and 4,429.5 TWh over the trailing 12 months says the system is expanding. The 8.53 cents/kWh industrial rate says that expansion is not free. That tension, and not any single headline number, is the real grid capacity for AI question.
We walk through the full baseline, the nuclear-versus-solar mix, industrial prices, gas volatility, and the capital framing in the report: The National Grid’s Capacity Problem.