
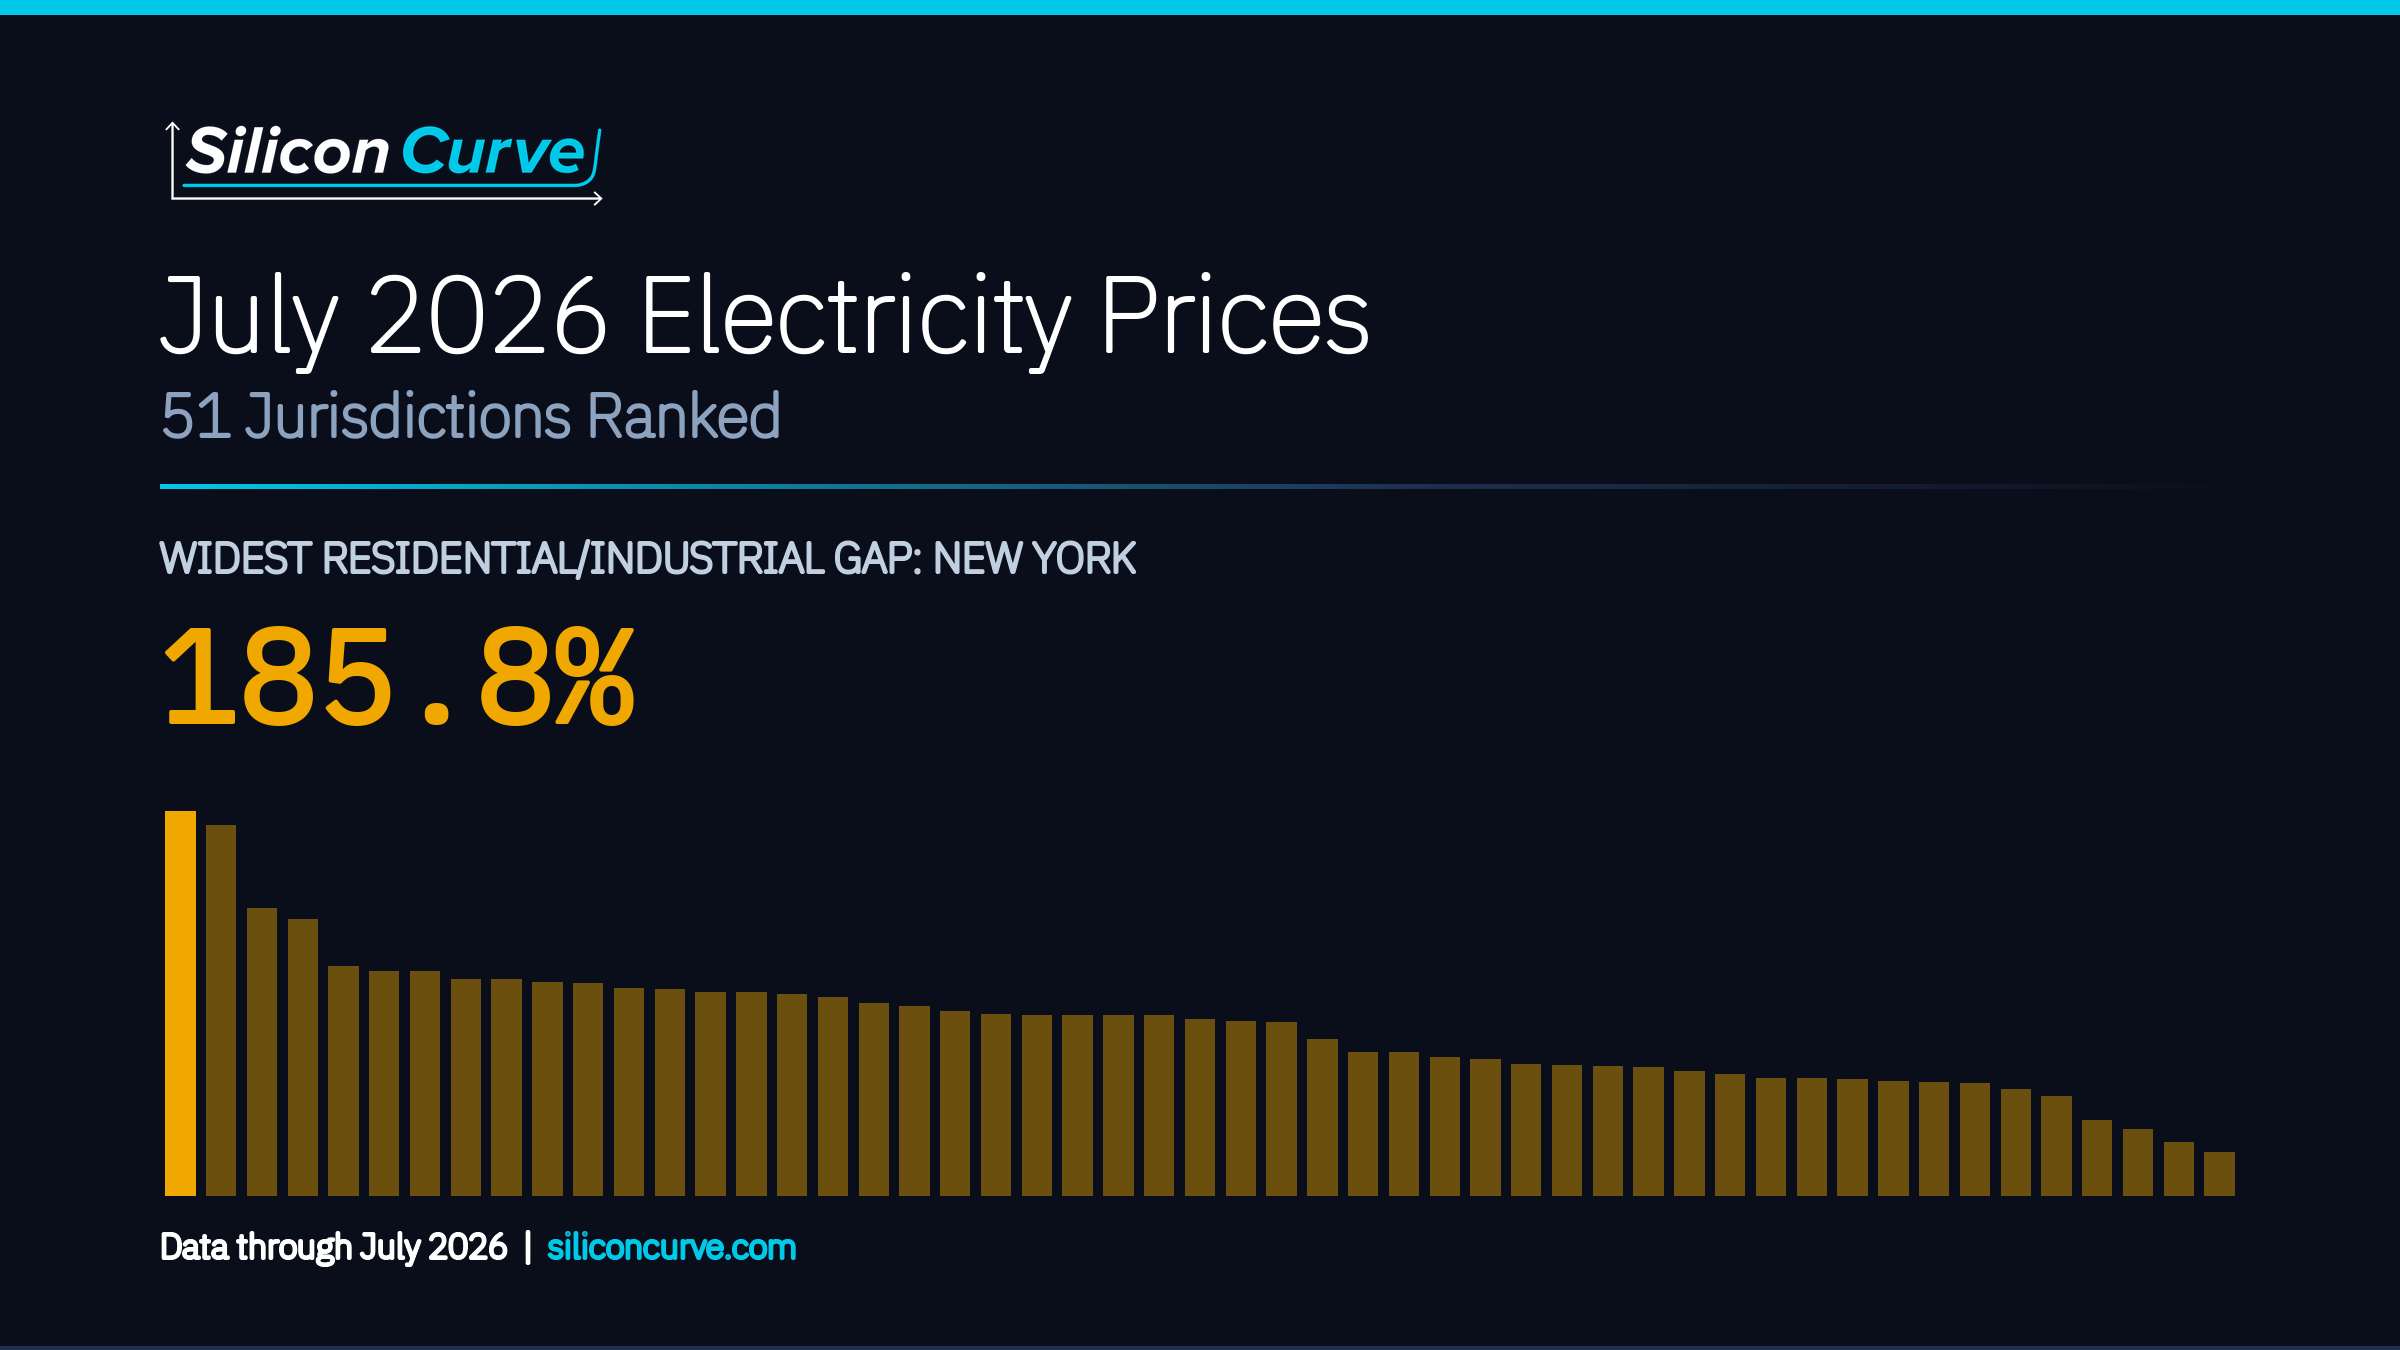
July 2026 Electricity Prices: 51 Jurisdictions Ranked
July 2026 electricity prices rose year-over-year in 45 of 51 jurisdictions for residential customers, with a median increase of 5.2% and the U.S. residential-to-industrial spread holding at 102.6%.
July 2026 electricity prices rose against a year earlier in most of the country: across 51 U.S. jurisdictions, residential retail prices in July 2026 were higher than in July 2025 in 45, with a median increase of 5.2% and a national increase of 4.9%. The largest residential rise was Hawaii at 22.0%; the largest decline was Connecticut at -12.5%.
The thesis of this edition is narrow: the year-over-year price picture through July 2026 is broadly upward but far from uniform, with residential increases spanning a 34.5-point range from Connecticut to Hawaii, while the standing rate-class gaps that anchor this series barely moved. Against that standing finding, the residential-to-industrial spread held: the national benchmark eased from 102.7% in the June 2026 edition to 102.6%, and the median across jurisdictions was 85.0%.
6 jurisdictions fell
p25 +2.9%, p75 +11.2%
Was 102.7% in June 2026 edition
Was 9 in June 2026 edition
Prices rose almost everywhere and the gaps barely moved. Residential prices were higher than a year earlier in 45 of 51 jurisdictions, at a median of 5.2%, while the national residential-to-industrial spread eased from 102.7% in the June 2026 edition to 102.6%. The movement this month is in the price level, not in the rate-class structure.
This edition leads with what moved since June 2026 and treats the standing rate-class rankings as context, restated with July 2026 figures. The residential-to-industrial and commercial-to-industrial spreads are computed on trailing 12-month mean prices to cancel seasonality; the year-over-year price changes compare July 2026 to July 2025, the same calendar month, which is inherently seasonally fair. The dataset is prices only and supports no explanation of cause.
These figures are retail prices in cents per kilowatt-hour, not bills. A bill depends on usage, which this dataset does not contain. Retail price increases reflect multiple factors including general inflation, fuel costs, utility capital investment cycles, and potentially incremental load. Do not attribute to a single cause.
TABLE OF CONTENTS
- Executive SummaryFree
- July 2026 Against a Year Earlier🔒
- The Residential Gap, Ranked🔒
- The Commercial Gap, Ranked🔒
- Where Things Stand🔒
- What to Watch Next Month🔒
- Methodology🔒
- Data Appendix🔒
- Endnotes🔒
- U.S. Energy Information Administration
Edition 2 of Electricity Prices by State ranks all 50 states, the District of Columbia and the U.S. total on July 2026 retail electricity prices by customer class. It reports year-over-year residential, commercial and industrial price changes, the ranked residential-to-industrial and commercial-to-industrial spreads on trailing 12-month means, and what moved since the June 2026 edition.
Read the Full Report ($49 value)
Every chart, table and appendix, unlocked instantly and yours for the life of the report.
No credit card or account required.
We'll also send you our newsletter. Unsubscribe at any time.
Or Buy It Outright
Buy This Report, $49One report, yours permanently. The free copy is one per reader.