
The National Grid's Capacity Problem: Can U.S. Power Supply Keep Pace with AI?
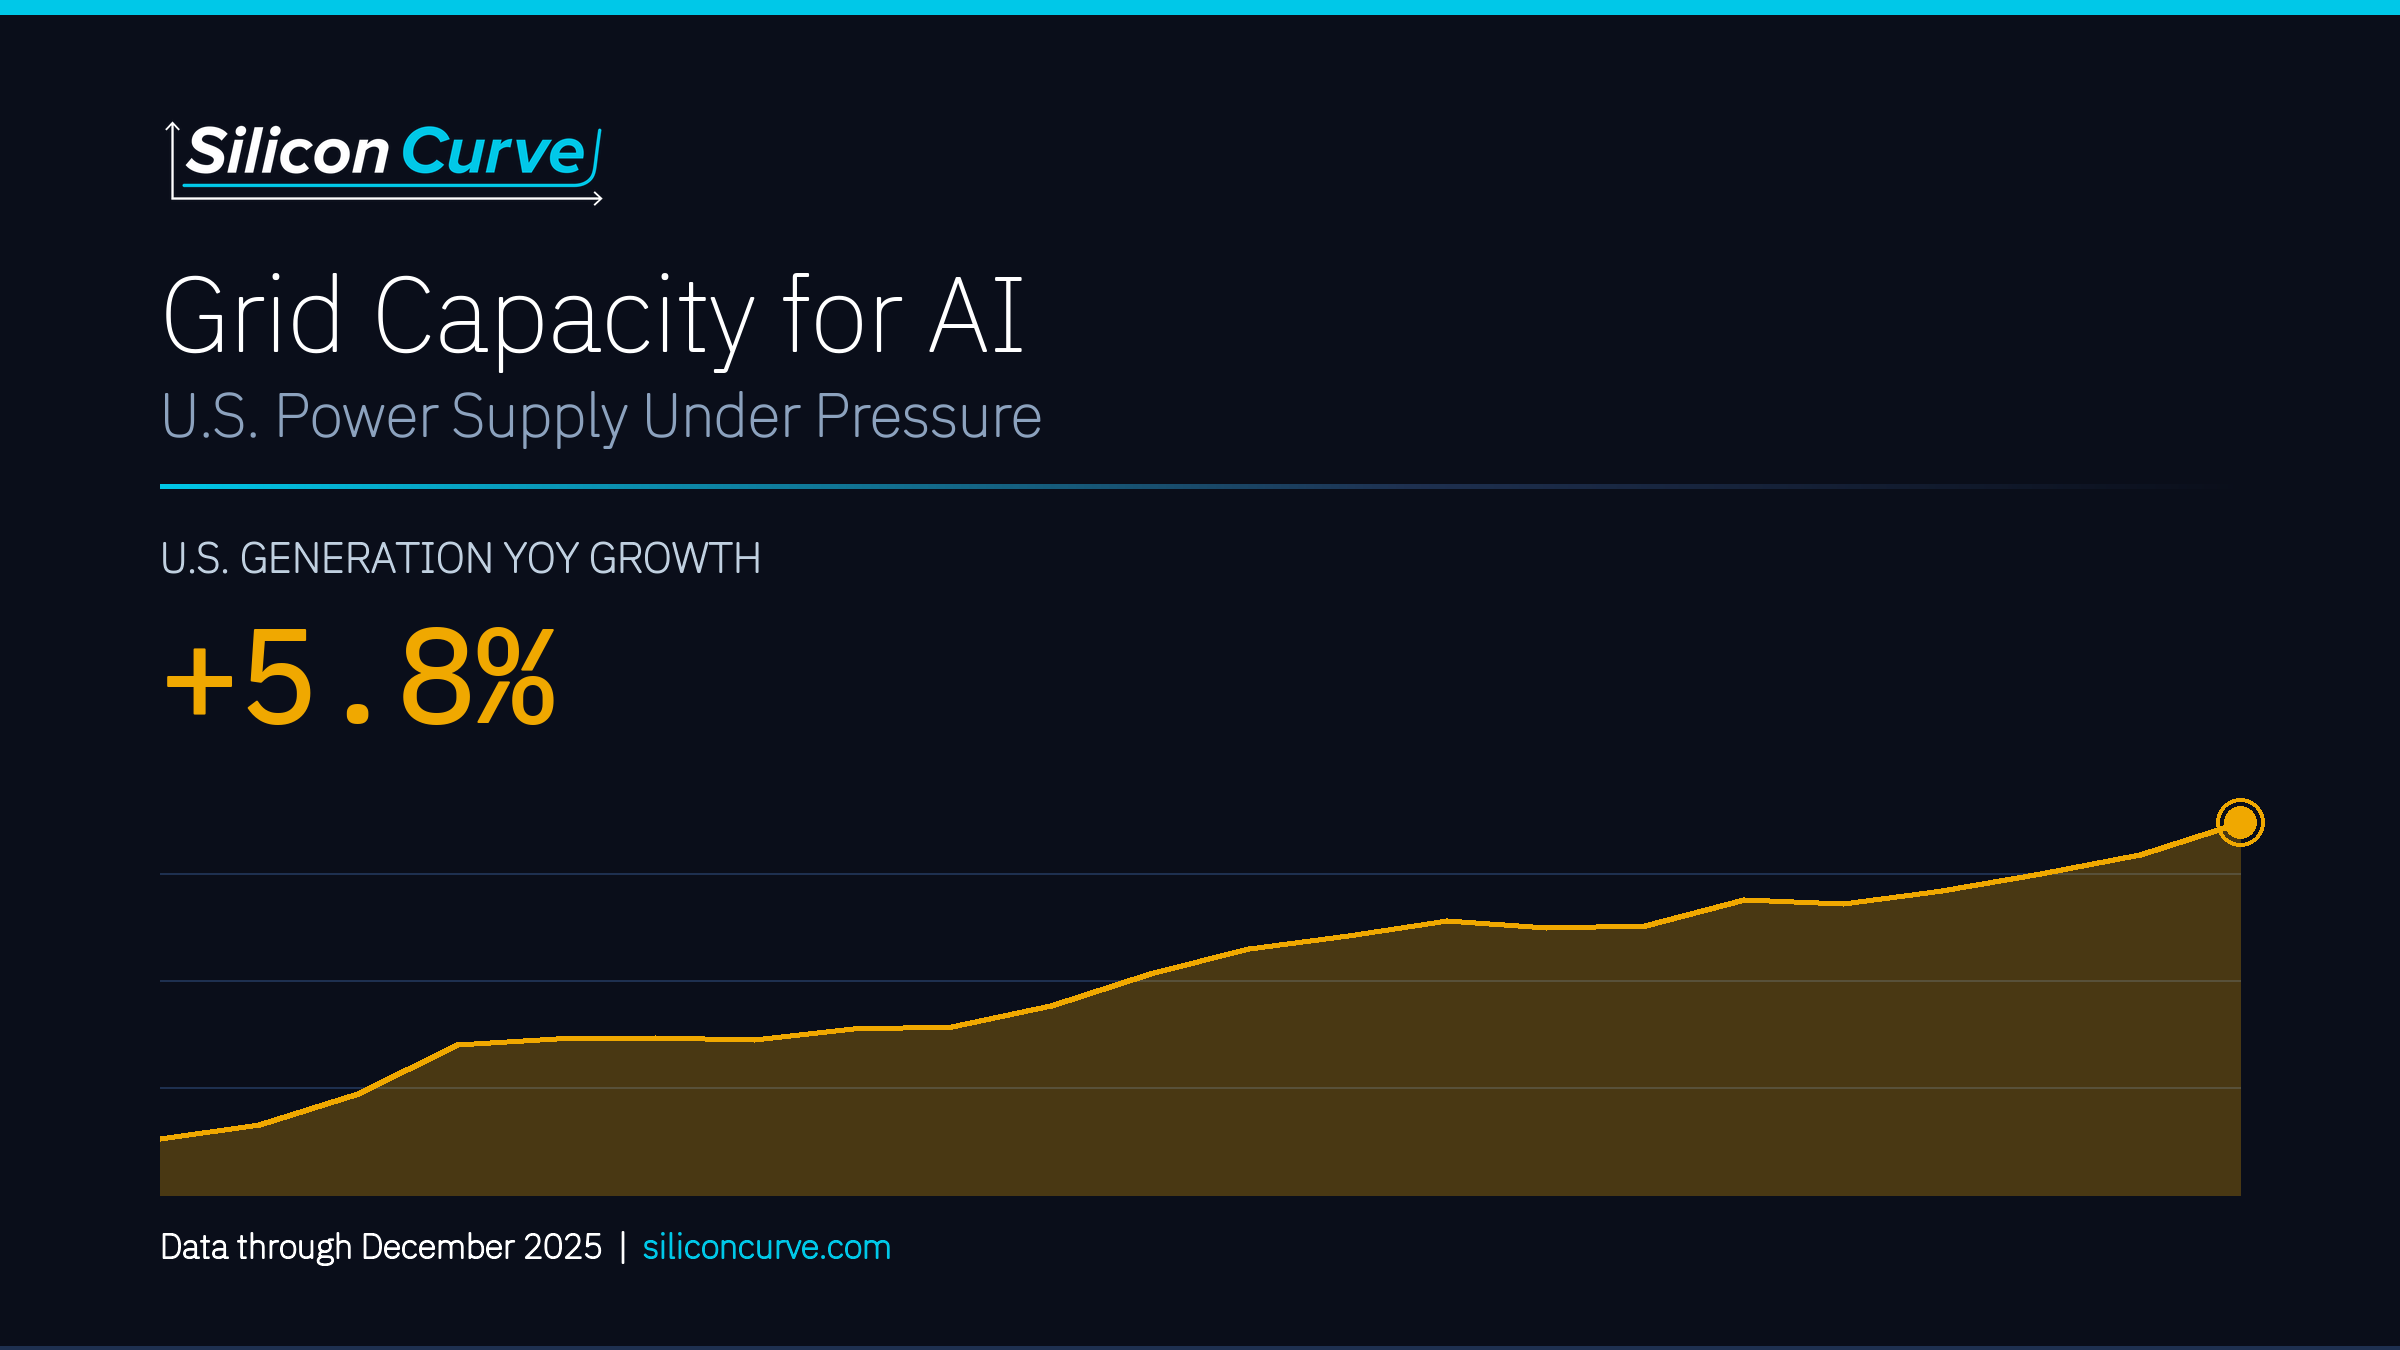
U.S. net electricity generation totaled 4,429.5 TWh over the 12 months through December 2025, with total generation up 5.8% year-over-year in the latest month.
The question of grid capacity for AI has moved from forecast to measurable trend. After roughly two decades of essentially flat U.S. electricity demand, load is growing again alongside a wave of large announced compute and data-center projects. This report examines the national grid at scale: whether U.S. power supply and its evolving fuel mix are expanding to meet AI-era demand, and what that demand environment is doing to the prices large electricity consumers face. Every figure here traces to federal agency data through December 2025.
U.S. net electricity generation totaled 4,429.5 TWh over the 12 months through December 2025, and generation in December 2025 was 5.8% above December 2024. Peak monthly output within the 33-month window reached 446.3 TWh in July 2025, versus a trough of 301.9 TWh in April 2023, a reminder that generation swings seasonally with summer cooling load and scheduled maintenance. A single monthly or year-over-year point should be read in that seasonal context rather than as pure structural change.
The buildout is capital-intensive enough that it is appearing in official national accounts. Private fixed investment in information processing equipment and software reached 1,466.4 $B (seasonally adjusted annual rate) in Q4 2025, up 19.5% year-over-year. This is an economy-wide measure of technology capital deployment, not a data-center-specific or company-specific figure, and it is presented here only to frame the scale of the investment environment.
U.S. generation in December 2025 was up 5.8% year-over-year, and totaled 4,429.5 TWh over the trailing 12 months, while industrial electricity prices reached 8.53¢/kWh, evidence that supply is expanding but that large consumers are paying more in the process. Retail price increases reflect multiple factors including general inflation, fuel costs, utility capital investment cycles, and potentially incremental load; do not attribute to a single cause.
Total U.S. net electricity generation across all sectors and fuels over the 12 months through December 2025.
The national average industrial retail electricity price rose to 8.53¢/kWh in December 2025, up from 7.96¢/kWh a year earlier.
Solar net generation reached 15.4 TWh in December 2025 versus 12.6 TWh a year earlier, far outpacing nuclear's 1.9% year-over-year change.
The fuel-mix contrast is structural. Nuclear net generation reached 72.5 TWh in December 2025, up 1.9% year-over-year, contributing 784.8 TWh over the trailing 12 months, a near-constant baseload profile. Solar generation totaled 295.7 TWh over the same 12 months and swings sharply by season, peaking at 33.4 TWh in July 2025 against a trough of 9.1 TWh in December 2023. On the fuel-cost side, the 12-month average Henry Hub natural gas spot price through December 2025 was $3.53/MMBtu, and the December 2025 monthly value of $4.26/MMBtu was up 41.5% from December 2024, a single-month spike well above the steadier 12-month average. Summer electricity price peaks are driven by multiple factors; do not label peaks as caused by AI load without supporting data.
Not all demand growth is attributable to data centers, weather and broader electrification also move load, and generation swings seasonally. Operating cost estimates based on industrial rates may differ from actual facility costs depending on power purchase agreement structure, and the IT investment series is economy-wide, not a data-center-specific measure.
TABLE OF CONTENTS
- Executive SummaryFree
- The National Grid Baseline🔒
- The Fuel Mix: Nuclear Baseload vs. Solar Growth🔒
- The Price Signal: What Large Consumers Are Paying🔒
- Fuel Cost and Volatility: Henry Hub Natural Gas🔒
- The Capital Behind the Buildout🔒
- The Bottom Line🔒
- Data Appendix🔒
- Endnotes🔒
- U.S. Energy Information Administration
- Federal Reserve Bank of St. Louis / BEA
- Federal Reserve Bank of St. Louis / EIA
Unlock the Full Report
The full report details the national grid baseline, the nuclear-versus-solar fuel mix, industrial electricity price trends, Henry Hub natural gas cost and volatility, and the economy-wide IT capital deployment framing the AI infrastructure buildout, all sourced to EIA and FRED/BEA data through December 2025.
Unlock This Report for Only $49