
Solar vs Nuclear for Data Centers: A Cold Economic Comparison
U.S. nuclear generation totaled 786.0 TWh over the 12 months through April 2026 while solar totaled 313.1 TWh, framing two opposite ends of the firmness spectrum for AI data center power.
The solar vs nuclear question sits at the center of data center siting economics because AI facilities require firm, around-the-clock power. This report compares the two generation profiles using U.S. Energy Information Administration (EIA) net generation data through April 2026. Nuclear operates as near-constant baseload; solar is variable by time of day and season. The dataset contains generation volumes and retail prices only, it carries no generation-cost or levelized-cost data, so this is a comparison of profiles and volumes, not a cost verdict.
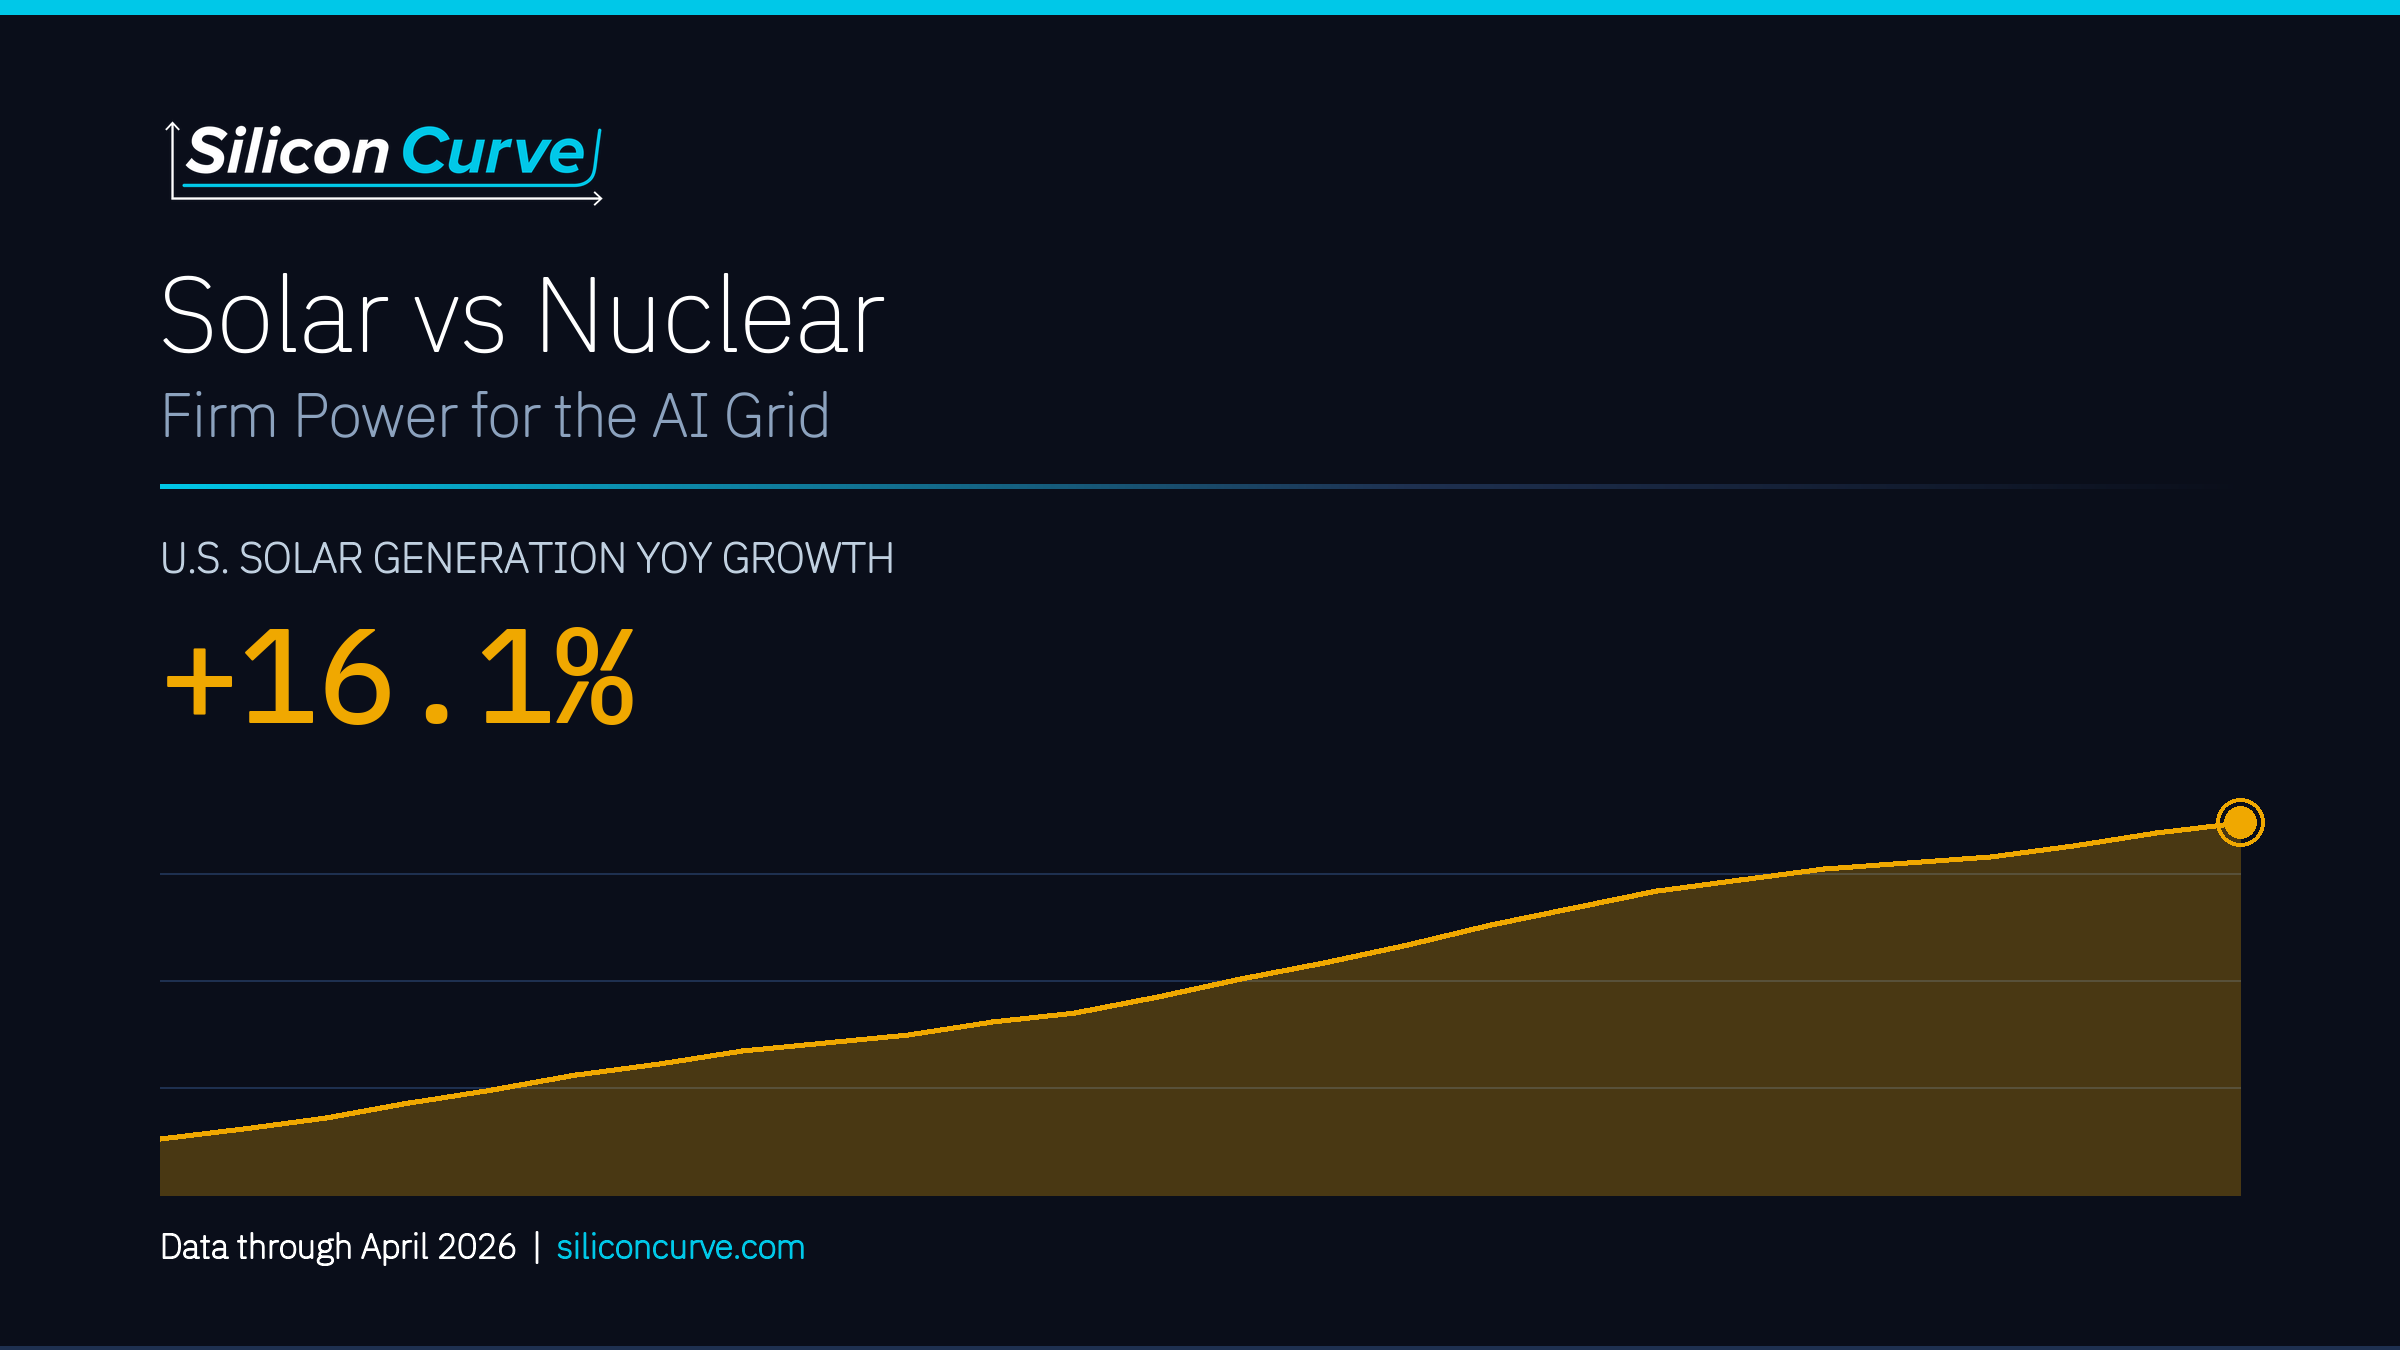
Over the 12 months through April 2026, nuclear generation reached 786.0 TWh against solar's 313.1 TWh. Nuclear generation recorded a year-over-year change of -0.9% in April 2026; U.S. nuclear output dips each spring and fall for scheduled refueling outages, so a flat April-over-April reading reflects seasonal maintenance rather than a capacity decline. Solar generation increased 16.1% year-over-year in April 2026, extending a rapid volume trajectory from a 36-month trough of 9.1 TWh in December 2023.
Against this backdrop, U.S. total net electricity generation totaled 4,456.3 TWh over the 12 months through April 2026, up 3.2% year-over-year in April. Information processing equipment and software investment reached 1,556.5 $B (seasonally adjusted annual rate) in Q1 2026, an economy-wide capital signal, not a data-center-specific measure, providing macro context for the infrastructure buildout.
Nuclear generation totaled 786.0 TWh over the 12 months through April 2026 versus solar's 313.1 TWh; solar's 16.1% year-over-year growth is a volume story, not yet a firm-capacity story for data centers that require around-the-clock power.
U.S. nuclear net generation over the 12 months through April 2026, more than double solar's total over the same period.
Solar net generation rose 16.1% year-over-year in April 2026, extending its rapid volume expansion.
Solar monthly output swung from a 36-month trough of 9.1 TWh in December 2023 to a peak of 33.4 TWh in July 2025, illustrating its variability versus nuclear's near-constant profile.
Industrial electricity prices, the relevant tier for hyperscale data centers, reached 8.66¢/kWh in April 2026, up 5.5% year-over-year, with a 12-month rolling average of 8.81¢/kWh. Operating cost estimates based on industrial rates may differ from actual facility costs depending on power purchase agreement structure. Retail price increases reflect multiple factors including general inflation, fuel costs, utility capital investment cycles, and potentially incremental load; do not attribute to a single cause. At the state level, Texas generation totaled 594.8 TWh over the 12 months through April 2026 (+7.2% year-over-year), while Virginia totaled 105.2 TWh; Virginia's -11.7% April-over-April reading reflects a single-month comparison against a monthly series.
This dataset contains generation volumes and retail prices only, no levelized-cost or generation-cost data. Solar's volume growth cannot be read as a firm-capacity or cost advantage for facilities requiring 24/7 power.
TABLE OF CONTENTS
- Executive SummaryFree
- Grid Baseline: National Scale and Capacity Context🔒
- Nuclear: The Firm Baseload Reference🔒
- Solar: The Volume Growth Story🔒
- Operating Cost Context: Industrial Electricity Prices🔒
- State Lens: Virginia and Texas Load🔒
- Capital Signal: IT Investment Behind the Buildout🔒
- Synthesis: Profile, Not Cost🔒
- Data Appendix🔒
- Endnotes🔒
- U.S. Energy Information Administration
- Federal Reserve Bank of St. Louis / BEA
Unlock the Full Report
The full report compares U.S. nuclear and solar generation profiles for AI data center power, with national grid baseline, industrial price context, Virginia and Texas state load, and the IT investment capital signal behind the buildout.
Unlock This Report for Only $49