
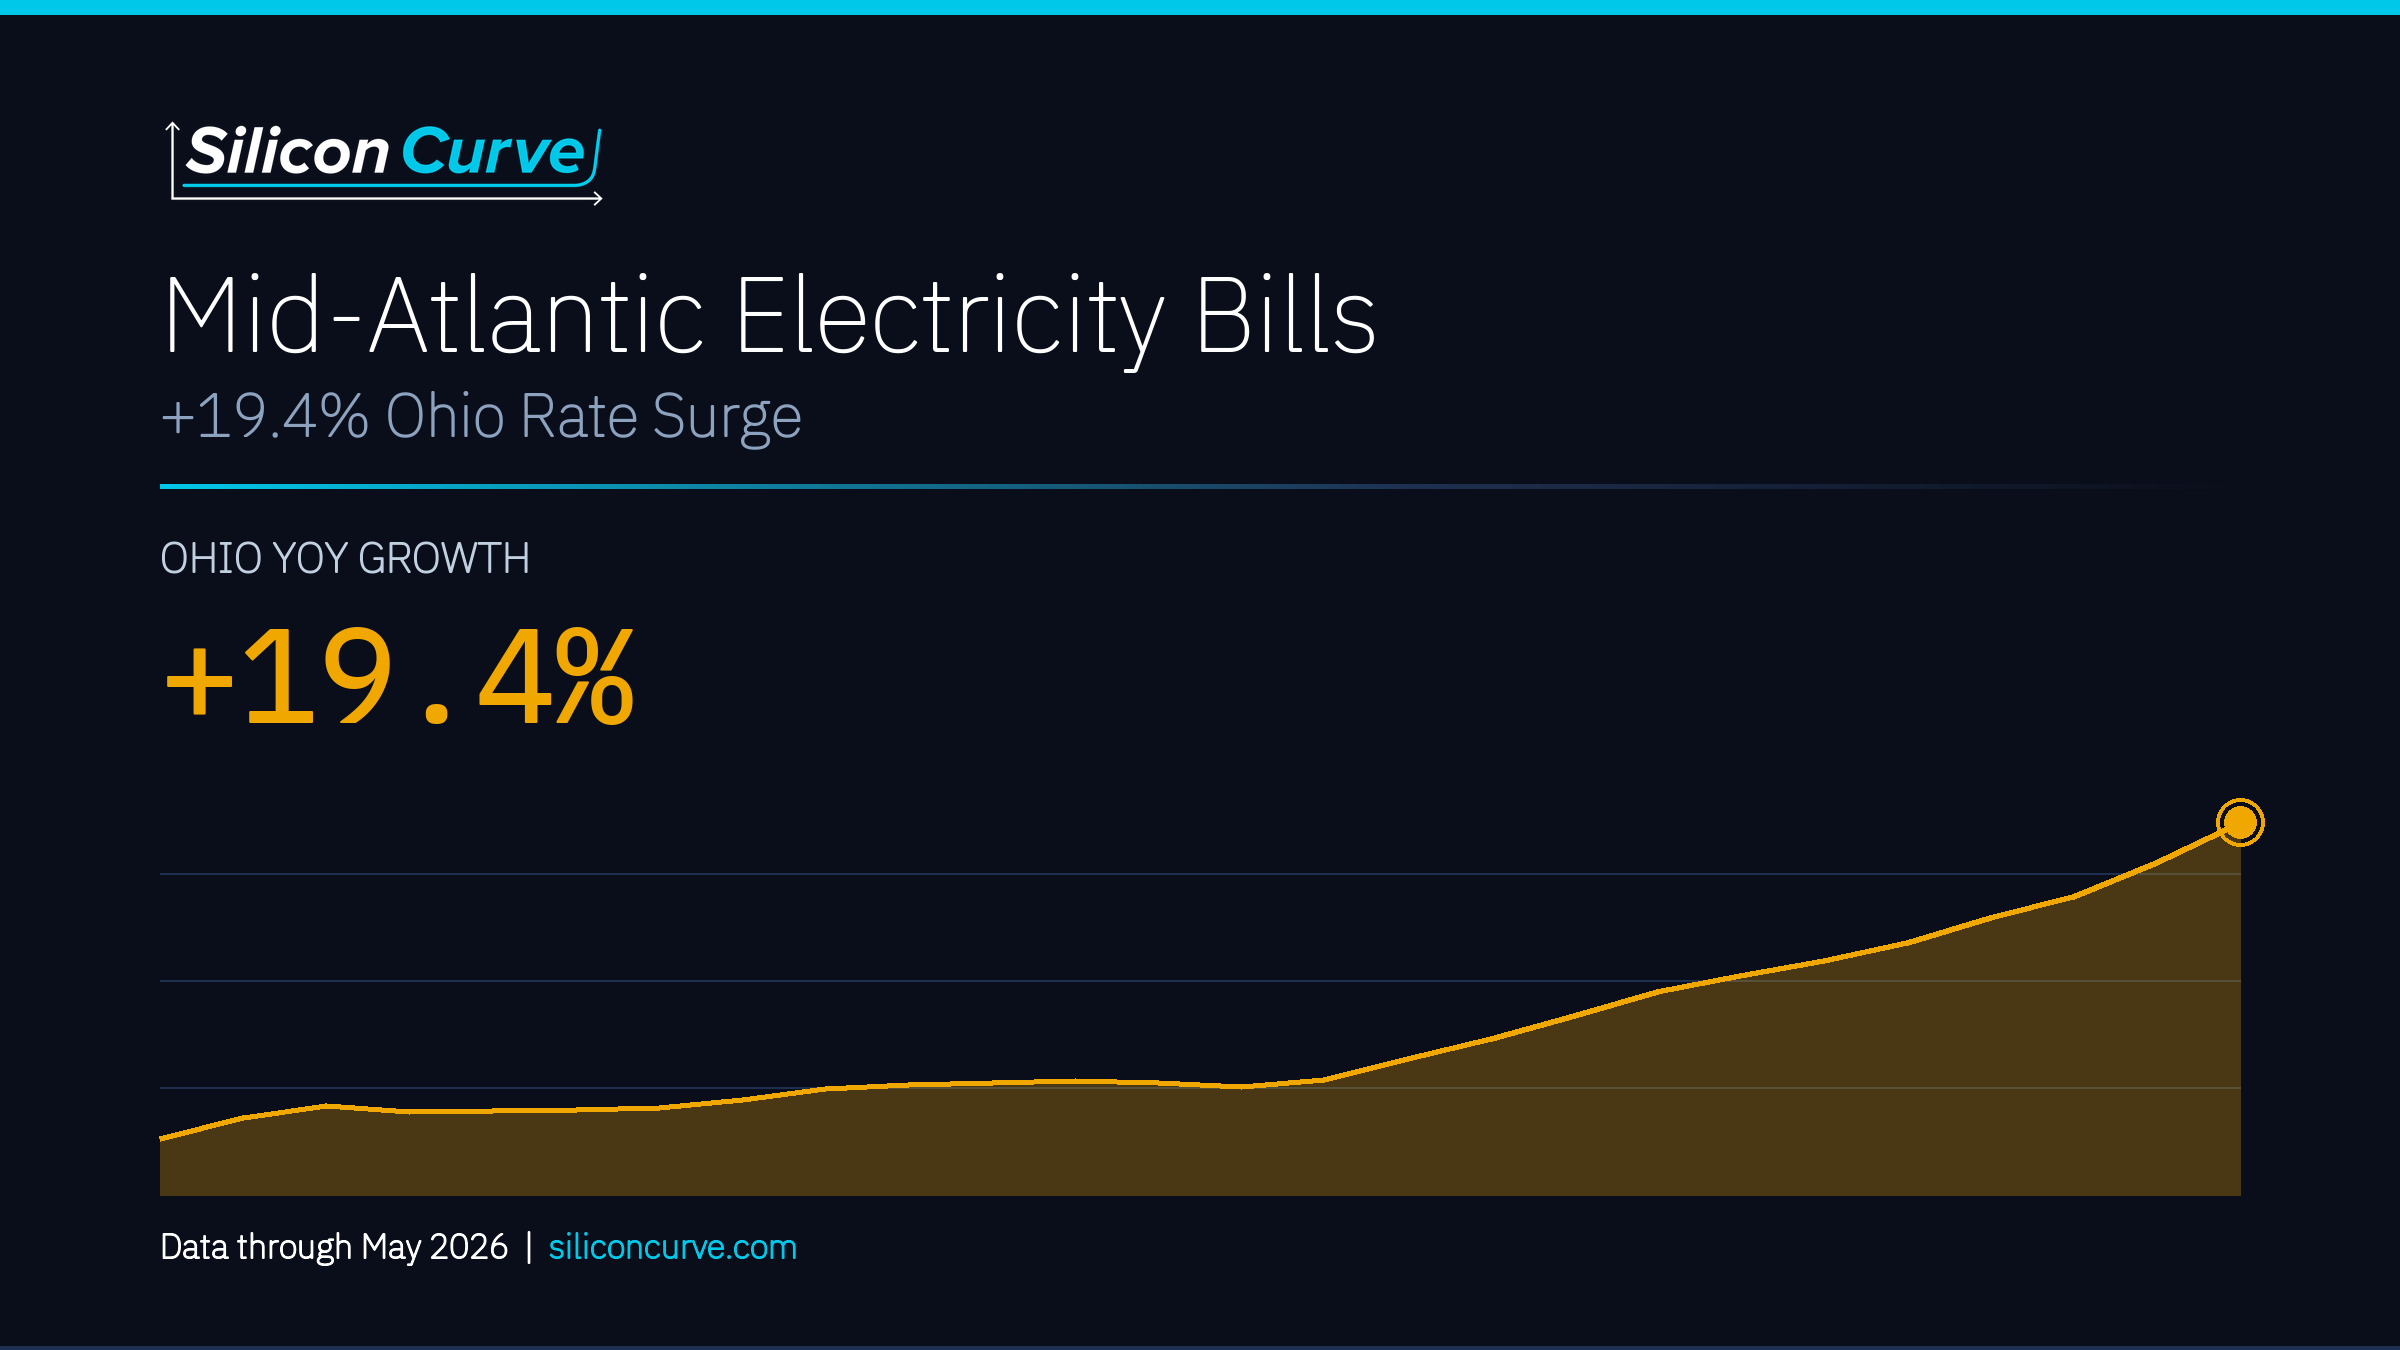
Mid-Atlantic Electricity Bills: +19.4% Ohio Rate Surge
Ohio residential electricity prices reached 19.49 cents/kWh in April 2026, a +19.4% year-over-year increase and the steepest household rate rise across the PJM mid-Atlantic core.
Residential electricity prices climbed by double-digit percentages across the PJM mid-Atlantic core through April 2026, with the PJM capacity market serving as the qualitative mechanism linking tightening regional supply to household bills. Ohio recorded the steepest year-over-year increase at +19.4%, reaching 19.49 cents/kWh in April 2026, followed by New Jersey at +16.8% (23.53 cents/kWh), Maryland at +15.9% (22.07 cents/kWh), Virginia at +13.7% (17.38 cents/kWh), and Pennsylvania at +13.2% (21.47 cents/kWh). Every state in the footprint posted its 36-month peak residential price at or near the most recent observation.
Over the same period, the U.S. industrial electricity rate, the tier relevant to hyperscale data centers, averaged 8.81 cents/kWh across the trailing 12 months and reached 8.66 cents/kWh in April 2026, up just +5.5% year-over-year. Operating cost estimates based on industrial rates may differ from actual facility costs depending on power purchase agreement structure. Retail price increases reflect multiple factors including general inflation, fuel costs, utility capital investment cycles, and potentially incremental load; they should not be attributed to a single cause.
Residential ratepayers across all five PJM mid-Atlantic states absorbed double-digit price increases through April 2026, led by Ohio at +19.4%, while the industrial tier that serves data centers rose only +5.5% nationally, a divergence consistent with a widening cost split between household and hyperscale consumers.
The steepest year-over-year residential rate increase in the PJM core, up +19.4% and a 36-month peak.
Ohio residential rates rose far faster than the +5.5% U.S. industrial rate that serves data centers.
Economy-wide IT capital deployment reached a series high, up +18.7% year-over-year, sustained expansion, not a data-center-specific measure.
Generation trends were not uniform across the footprint. U.S. net generation totaled 4,456.3 TWh over the 12 months through April 2026, up +3.2% year-over-year in the latest month. Within PJM, April 2026 generation fell year-over-year in Virginia (-11.7%), New Jersey (-8.8%) and Pennsylvania (-4.7%), while Maryland rose +13.7%. Virginia, the data center demand epicenter, recorded its 36-month generation trough in April 2026 at 6.2 TWh, underscoring its reliance on imports and PJM-wide capacity rather than in-state supply. Single-month figures should be read in seasonal context; spring is a recurring low for several of these states.
The 12-month rolling Henry Hub price and its -5.8% year-over-year change (May 2026 vs. May 2025) help separate fuel-driven from demand-driven movement, though the January 2026 spike to $7.72/MMBtu against the March 2024 trough of $1.49/MMBtu reflects significant intra-period volatility. Do not label residential price peaks as caused by AI load without supporting data. Commercial and residential retail movements reflect multiple factors including transmission, weather, and utility capital cycles.
No PJM capacity-auction clearing-price figure appears in the pulled dataset; the capacity market is treated here only as a qualitative mechanism. Attributing residential rate increases to data center load specifically would overstate what EIA retail price and state generation series can establish.
TABLE OF CONTENTS
- Executive SummaryFree
- The Household Bill Story: Double-Digit Increases Across the PJM Core🔒
- The Pass-Through Split: Industrial Rates vs. Residential Bills🔒
- Regional Generation: Supply Is Not Uniformly Keeping Pace🔒
- Virginia: Demand Epicenter, Net Importer🔒
- Maryland and New Jersey: Where the Bill Shock Is Sharpest🔒
- Pennsylvania and Ohio: The Broader Footprint🔒
- The Fuel-Cost Variable: Henry Hub Natural Gas🔒
- The Investment Backdrop: Economy-Wide IT Capital Deployment🔒
- Investor and Policy Implications🔒
- Data Appendix🔒
- Endnotes🔒
- U.S. Energy Information Administration
- Federal Reserve Bank of St. Louis / EIA
- Federal Reserve Bank of St. Louis / BEA
Unlock the Full Report
The full report breaks down residential price increases state by state across the PJM mid-Atlantic core, contrasts household rates against the U.S. industrial tier that serves data centers, examines divergent state generation trends and Virginia's net-importer position, isolates the Henry Hub fuel-cost variable, and situates the buildout within economy-wide IT capital deployment.
Unlock This Report for Only $49